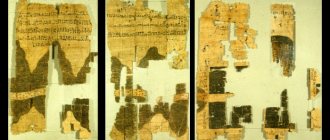
The science of reading maps and signs began to emerge simultaneously with the emergence of the most primitive writing. To this day, topographic maps can help solve a wide range of scientific and practical problems. The use of maps as specific models for displaying the surrounding reality in order to study the phenomena depicted on it is called the cartographic research method. These days, there are several ways to read topographic maps, depending on your goals. Now topographic maps are widely used for both research and military purposes, since this method of displaying information about the surrounding reality has proven to be a high-quality, effective and universal source.
Topographic map concept
A topographic map is an accurate and detailed plan of a small area of territory for the purpose of its further in-depth study and identification of patterns and relationships. A topographic map is also called a graphic document of an area that contains visual images of the landscape and nearby features such as roads, cultural sites, vegetation and soil types, utilities, and more.
The branch of science that studies topographic maps is called topography.
The scale is of great importance in such a map, since it is a parameter for the accuracy and detail of the display on the map of various objects that exist in the selected area. The scale also indirectly determines the purpose of the map: different map details are suitable for different purposes of its use. For example, without reading topographic maps, military topography would become virtually impossible.
Development
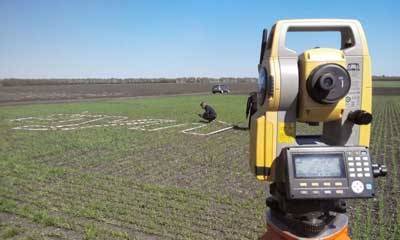
Their development requires topographic survey, which is carried out on the ground. This is the so-called field geodetic work .
They are issued electronically and on paper. Recently, 3D visualizations are increasingly being provided.
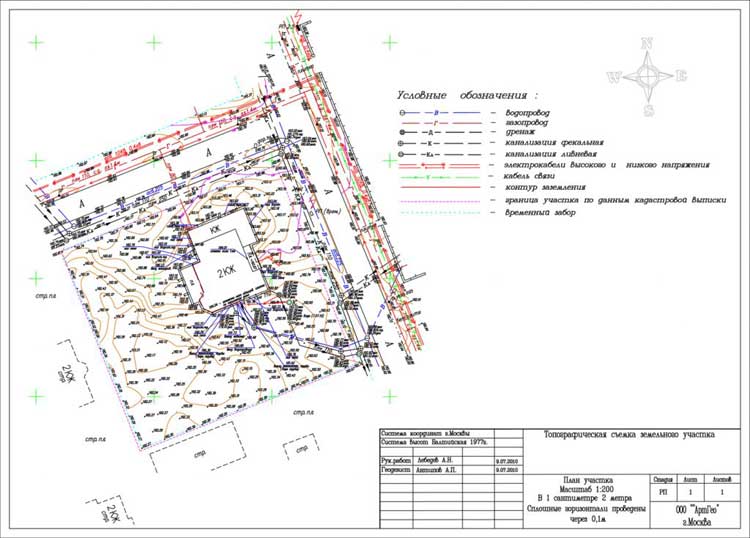
The topographic plan is carried out on a given scale, indicating all significant objects in symbols.
With developed skill, this makes it easy to figure out where the boundaries of the site and the location of communications pass. You can display the type of soil and determine which foundation to prefer for construction.
Content
Features displayed will appear differently on topographic maps and plans drawn at different scales.
It is difficult to display specific communications and trees on the map. The plan allows for detailing, including scale levels, the location of underground and above-ground communications, and the exact boundaries of a specific site, regardless of its size.
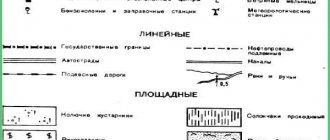
The following mandatory designations are used.
Basic:
- Terrain reliefs;
- Condition and features of the soil, including vegetation with detailed images;
- Hydrography, which represents water bodies;
- Roads of different levels;
- Network engineering;
- Buildings with signatures characterizing them - indicating the material used, number of floors and type (residential building, administrative building, school);
- Boundaries of settlements and certain areas.
Auxiliary:
- The basis is mathematical, which includes crosses indicating coordinates and terrain;
- Conventional symbols that do not correspond to commonly used meanings;
- Drawing stamp – includes information about the scale, date of manufacture and artist.
Possible scales
Depending on the required task, different area scales are used. They allow you to determine the ratio to the size on the ground and the reduction factor of the image compared to the original parameters.
The following types of scales are commonly used :
- 1:1 000 000;
- 1:500 000;
- 1:200 000;
- 1:100 000;
- 1:50 000;
- 1:25 000;
- 1:10 000.
The number in the denominator represents the degree of downscaling . A higher value always indicates a smaller and more detailed scale.
Graphics and nomenclature
The layout is a system of dividing a surface into parallels and meridians. Each sheet used is limited by a frame.
One of the following types of graphics can be used:
- Rectangular . The map is divided into square or rectangular sheets of the same size.
- Trapezoidal . Meridians and parallels are used as boundaries.
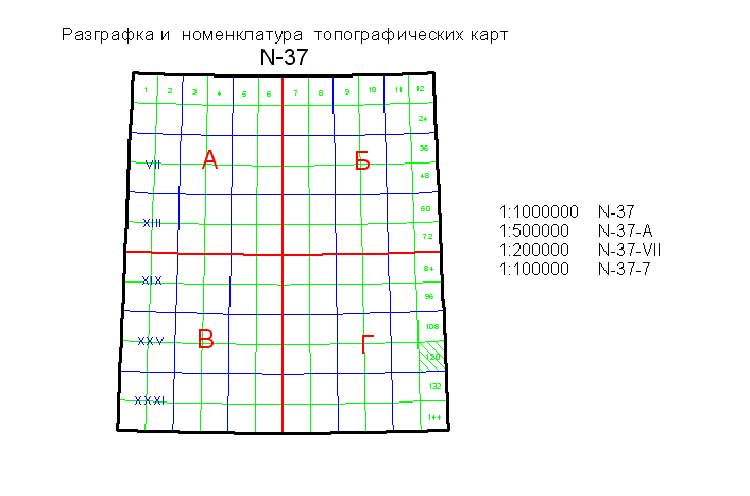
In Russia, the initial scale is 1:1,000,000 . It allows you to establish nomenclature for large scales. The concept of nomenclature in topography is not the same as in the usual sense. This is a system for designating sheets that are made at different scales.
For example, the nomenclature of sheets with scales 1:500 and 1:1000 is made up of the nomenclature 1:2000. To indicate a scale of 1:500, use the corresponding Arabic numeral, and for 1:1000, use a Roman numeral.
Classification by scale
Topographic maps are usually differentiated by scale. Different maps are created for different purposes, so the rules for reading topographic maps may differ slightly. The scale condition is especially relevant in military topography:
- Maps with a scale of about 1:10,000 – 1:25,000 are considered by cartographers and researchers to be the most detailed and the most detailed. Such maps are intended for careful consideration and analysis of individual sections of the territory. They are often used in military topography: the study of topographic maps of this scale helps unit commanders during airborne landings, as well as when crossing water barriers, fighting in cities or when building special structures. In addition, they are often used for high-precision measurements when performing work on engineering equipment of territories or topogeodetic preparation for shooting.
- The 1:50,000 scale is intended for territory analysis, target designation or orientation: reading topographic maps in such cases makes the task much easier. Typically used by military units in various types of combat operations, and in particular when creating defenses. During an offensive, the map is used to assess the surrounding area when breaking through enemy defenses, as well as to cross military barriers and when fighting for towns and cities. Such maps are also convenient to use for topographic and geodetic preparation of shooting, design of various military and engineering buildings, and in the course of making the necessary calculations on the engineering equipment of the territory.
- The scale of 1:100,000 is well suited for analyzing territories and assessing its capabilities when planning a battle, as well as organizing troops, terrain orientation and topographic geodetic reference. Additionally, reading and analyzing a topographic map is great for figuring out the coordinates of necessary objects or enemy objectives. Among other things, topographic maps are often used in the process of designing military engineering buildings and when performing various actions to equip territories.
- The study and analysis of topographic maps with a scale of 1:200,000 helps to cope with the organization of combat operations and subsequent command and control of troops. This map is also often used as a road map, since it perfectly displays the road network and its quality. In addition to roads, the map clearly demonstrates the nature of the landscape, often depicting in detail water and forest features and important settlements. That is why maps of this scale are used when analyzing terrain cross-country ability.
- Map scale 1:500,000 is often used to study the general nature of the terrain of a territory when conducting various operations. Topographic maps and the study of their rectangular coordinates facilitate the implementation of activities to organize interaction and control of troops, as well as orientation and mapping of the general military situation.
- The scale of 1:1,000,000 is sufficiently small and insufficiently detailed, so that it is suitable for the initial assessment of the territory and subsequent study of its main natural parameters: such maps cover large geographical areas. They are intended for military-geographical assessment of combat operations and actions, as well as for the purpose of organizing troops and solving many other issues.
Scale accuracy
The maximum possibility of measuring and constructing segments on maps and plans is limited to 0.01 cm. The corresponding number of meters of terrain on the scale of a map or plan represents the maximum graphic accuracy of a given scale.
Since the accuracy of the scale expresses the length of the horizontal location of the terrain line in meters, to determine it, the denominator of the numerical scale should be divided by 10,000 (1 m contains 10,000 segments of 0.01 cm). So, for a map at a scale of 1:25,000, the scale accuracy is 2.5 m; for a 1:100,000 map - 10 m, etc.
Scales of topographic maps
| numerical map scale | card name | 1 cm on the map corresponds to a distance on the ground | 1 cm2 on the map corresponds to an area on the ground |
| 1:5 000 | five thousandth | 50 m | 0.25 ha |
| 1:10 000 | ten-thousandth | 100 m | 1 ha |
| 1:25 000 | twenty-five thousandth | 250 m | 6.25 ha |
| 1:50 000 | fifty thousandth | 500 m | 25 hectares |
| 1:1100 000 | hundred thousandth | 1 km | 1 km2 |
| 1:200 000 | two hundred thousandth | 2 km | 4 km2 |
| 1:500 000 | five hundred thousandth, or half a millionth | 5 km | 25 km2 |
| 1:1000000 | millionth | 10 km | 100 km2 |
Below are the numerical scales of the maps and the corresponding named scales:
Scale 1:100,000
- 1 mm on the map – 100 m (0.1 km) on the ground
- 1 cm on the map – 1000 m (1 km) on the ground
- 10 cm on the map – 10,000 m (10 km) on the ground
Scale 1:10000
- 1 mm on the map – 10 m (0.01 km) on the ground
- 1 cm on the map – 100 m (0.1 km) on the ground
- 10 cm on the map – 1000 m (1 km) on the ground
Scale 1:5000
- 1 mm on the map – 5 m (0.005 km) on the ground
- 1 cm on the map – 50 m (0.05 km) on the ground
- 10 cm on the map – 500 m (0.5 km) on the ground
Scale 1:2000
- 1 mm on the map – 2 m (0.002 km) on the ground
- 1 cm on the map – 20 m (0.02 km) on the ground
- 10 cm on the map – 200 m (0.2 km) on the ground
Scale 1:1000
- 1 mm on the map – 100 cm (1 m) on the ground
- 1 cm on the map – 1000 cm (10 m) on the ground
- 10 cm on the map – 100 m on the ground
Scale 1:500
- 1 mm on the map – 50 cm (0.5 m) on the ground
- 1 cm on the map – 5 m on the ground
- 10 cm on the map – 50 m on the ground
Scale 1:200
- 1 mm on the map – 0.2 m (20 cm) on the ground
- 1 cm on the map – 2 m (200 cm) on the ground
- 10 cm on the map – 20 m (0.2 km) on the ground
Scale 1:100
- 1 mm on the map – 0.1 m (10 cm) on the ground
- 1 cm on the map – 1 m (100 cm) on the ground
- 10 cm on the map – 10 m (0.01 km) on the ground
Example 1
Convert the numerical scale of the map to a named one:
- 1:200 000
- 1:10 000 000
- 1:25 000
Solution:
To more easily convert a numerical scale into a named one, you need to count how many zeros the number in the denominator ends with.
For example, on a scale of 1:500,000, there are five zeros in the denominator after the number 5.
If after the number in the denominator there are five more zeros, then by covering (with a finger, a pen or simply crossing out) the five zeros, we get the number of kilometers on the ground corresponding to 1 centimeter on the map.
Example for scale 1:500,000
The denominator after the number has five zeros. Closing them, we get for a named scale: 1 cm on the map is 5 kilometers on the ground.
If there are less than five zeros after the number in the denominator, then by closing two zeros, we get the number of meters on the ground corresponding to 1 centimeter on the map.
we close two zeros in the denominator of a scale of 1:10,000
in 1 cm – 100 m.
Answers:
- 1 cm – 2 km
- 1 cm – 100 km
- in 1 cm – 250 m
Use a ruler and place it on the maps to make it easier to measure distances.
Example 2
Convert the named scale to a numerical one:
- in 1 cm – 500 m
- 1 cm – 10 km
- 1 cm – 250 km
Solution:
To more easily convert a named scale to a numerical one, you need to convert the distance on the ground indicated in the named scale into centimeters.
If the distance on the ground is expressed in meters, then to obtain the denominator of the numerical scale, you need to assign two zeros, if in kilometers, then five zeros.
For example, for a named scale of 1 cm - 100 m, the distance on the ground is expressed in meters, so for the numerical scale we assign two zeros and get: 1:10 000.
For a scale of 1 cm - 5 km, we add five zeros to the five and get: 1:500 000.
Answers:
- 1:50 000
- 1:1 000 000
- 1:25 000 000
Types of maps depending on scale
Depending on the scale, maps are conventionally divided into the following types:
- topographic plans 1:400 – 1:5 000
- large-scale topographic maps 1:10,000 – 1:100,000
- medium-scale topographic maps from 1:200,000 – 1:1,000,000
- small-scale topographic maps less than 1:1,000,000
The concept of conventional signs
Conventional signs are special symbols that mark the location of a particular object in a designated area. The designation is intended to convey the quantitative and qualitative characteristics of an object on the map. Currently, 465 symbols are used for this purpose in the Russian Federation and the CIS countries. Correct reading of maps and symbols will lead to the most complete and correct understanding of the information contained in the topographic map.
Groups of identical objects on the ground are displayed on maps using a basic symbol. The qualitative or quantitative characteristics of objects in this group are indicated by complicating the main symbol.
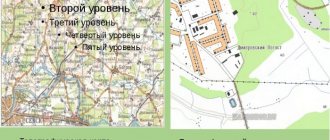
The larger the map scale, the greater the number of objects with more accurate details that can be displayed on a given area of the terrain. When the scale is reduced, the information content of the map decreases due to the reduction in free space on the sheet.
Large-scale maps (1:25,000 – 1:10,000) display, whenever possible, all local objects and their individual features with practical significance. On images with a smaller scale (1: 200,000 – 1:500,000) only the most essential characteristics will be displayed, with a rather serious generalization of the outlines and simplification of other indicators.
Concept of plan and map. Basic properties and elements of topographic maps
Concept of plan and map. Basic properties and elements of topographic maps
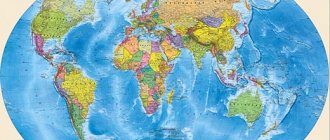
A plan is an image in a similar and reduced form of a projection of a site onto a horizontal plane. Plans that show only the contours of terrain elements without depicting the relief of the site are called contour plans. If the plans show the terrain along with the situation, then such plans are called topographical. When depicting large areas on paper, it is necessary to take into account the curvature of the Earth. Therefore, when compiling maps over large areas, the contours of the terrain are first projected not onto a horizontal plane, but onto the spherical surface of an ellipsoid or globe. The terrain projection obtained in this way also cannot be transferred to a plane (paper) in a similar and reduced form, since it is impossible to unfold a spherical surface on a plane without folds or breaks. Therefore, to transition from the spherical surface of the entire or significant part of the earth's surface, map projections are used, which can be obtained by analytical, graphic-analytical, geometric methods and perspective projection. Consequently, a map is a reduced generalized image on the plane of the entire Earth or part of it, taking into account the curvature of the level surface. Based on their content, geographic maps are usually divided into general geographic and thematic. On general geographical maps, the subject of the image is physical-geographical (relief, soil, vegetation cover, hydrography, etc.) and socio-economic (settlements, road network, economic facilities, etc.) elements. Thematic maps are based on general geographic maps, on which one of the elements of the general geographic map is depicted with particular completeness and detail (relief, hydrography, settlements, etc.), while other elements are displayed in less detail or not shown at all, but additionally apply special elements (climate, economic information, etc.). General geographic maps, depending on the scale, are divided into overview (smaller scale 1:1,000,000), overview-topographic (1:1,000,000 –1:500,000) and topographic (1:200,000 – 1:10,000). In turn, topographic maps are divided into small-scale (1:100,000 – 1:200,000); medium-scale (1:25,000 – 1:50,000) and large-scale (1:5,000 – 1:10,000). Cartographic images at a scale of 1:5,000 are classified as maps if a cartographic projection was used in their creation, in other cases they are classified as topographic plans. Topographic plans are published on a scale of 1:5000; 1:2000; 1:1000 and 1:500. Basic properties and elements of topographic maps
Topographic maps, like all general geographic maps, differ from other images of the earth's surface (globes, space and aerial photographs, etc.) in three properties: 1) the use of a mathematically defined method of depicting the earth's surface on a plane, for which cartographic projections are used; 2) the use of cartographic symbols (legend) to show terrain objects with their quantitative and qualitative characteristics, as well as to depict the relief; 3) the use of cartographic generalization in the selection and generalization of depicted terrain objects. The elements of a map include the cartographic image itself, the mathematical basis, the legend and auxiliary equipment. The main part of the map is a cartographic image that conveys the content of the map, i.e., a set of information about the objects shown on the map, their location, properties and relationships. All cartographic images are built on a mathematical basis, which includes a cartographic projection and a geodetic basis (parameters of the earth's ellipsoid, geodetic reference network). The layout and graphics system of maps are directly related to the mathematical basis. A map projection is a mathematically defined way of displaying the surface of an ellipsoid or sphere on a plane. Cartographic projections include coordinate grids - cartographic and rectangular or kilometer grids, relative to which the positions and outlines of objects, contours, etc. are shown. A cartographic grid is an image of parallels and meridians on a map. A kilometer grid is a coordinate grid in a system of flat rectangular coordinates, the lines of which are drawn on the map at intervals corresponding to a certain number of kilometers. The points of intersection of grid lines on the map are called nodal points. Depending on the nature of the distortions, the following map projections are distinguished: 1) equiangular, in which there are no distortions of angles in an infinitely small area of the map, as a result of which the shapes of infinitesimal figures are not distorted in these projections and the length scale at any point remains the same in all directions, although it changes from point to point. Areas have significant distortions, especially on maps covering large areas; 2) equal-area, in which there are no area distortions on the map, but on maps with large coverage of the territory, significant distortions of angles and shapes occur; 3) arbitrary, in which there are distortions of angles and areas on the map in any proportion. It should be noted that on all map projections there are distortions in the length of lines and the length scale can be maintained in individual directions (lines). An important part of the map is the legend - a system of symbols and textual explanations used on the map that reveal the content. For topographic maps, special tables of symbols have been compiled, which are mandatory for use on all maps of the appropriate scale. Ancillary equipment of the map includes cartometric graphics and various reference information.
Here's more on the topic:
Topography Subject and tasks of topography and geodesy Units of measures in topography and geodesy Shape and dimensions of the Earth Methods for projecting the earth's surface Coordinate systems used in topography and geodesy Analysis of topographic maps. Geographic description of terrain Geodetic reference networks Orientation of directions in topography and geodesy The concept of electromagnetic distance measurements Determination of the sides of the horizon by celestial bodies and local objects The concept of satellite positioning systems Planned survey geodetic network
Classification of conventional signs
Reading topographic maps without symbols would be extremely difficult and practically useless. Signs and conventional lines are an integral part of the topographic plan. There are many conventional signs; they are divided into different groups according to different criteria. However, basically topographic signs for reading a topographic map are divided into the following groups:
- large-scale:
- off-scale;
- explanatory.
To understand the difference between these three categories, it is worth considering each of them in more detail.
Large-scale
Scale symbols or contour symbols - they are used on topographic maps to mark objects that can be expressed on the scale of this map: their numerical parameters, such as length, area or width, can be easily measured on the map. Icons in this group include an outline (the outline of an object) and an explanatory designation within the outline in the form of a color fill, hatching, or a grid of small symbols identical in pattern (these are called memory signs) that indicate the type of object. Contours are usually marked with dotted lines if they do not intersect other important terrain lines (for example, they may coincide with a coastline, road, ditch, etc.).
Off-scale
Out-of-scale objects or objects with point symbols mark small single objects, be they monuments, single houses, wells, water towers, etc. Objects of this kind are not expressed to scale. The figurative symbol of a point symbol has a main point, which marks the exact location of an object on the ground, while simultaneously indicating the type of object. The main point is essentially a geometric center - such points should be used when searching for the exact coordinates of objects on the ground or if there is a need to measure the distances between them.
Off-scale signs are divided into 4 groups according to their location in relation to the main point:
- signs with a center of symmetry (circle, rectangle, asterisk, square, etc.) – the central point coincides with the center of symmetry;
- signs with a wide base: the main point is in the middle of the base;
- signs with a base in the shape of a right angle: the main point will be at the apex of the angle;
- signs that combine several symbols: the main point will be in the center of symmetry of the lower figure.
Design of topographic maps
When reading topographic maps and their rectangular coordinates, it is necessary to pay attention not only to the map image itself, but also to the external border design. It contains equally important information about the area depicted on the topographic map. Each sheet has a variety of information outside the map frame that is necessary to read the topographic plan of the area map.
Firstly, under the nomenclature there should be the number and year of publication of the map - this is especially important when working with old maps, since the information on it may be outdated and even irrelevant in modern realities due to the changing landscape of the area or the development of territories.
Secondly, under the lower border of the frame on the left side there is information about the magnetic declination, as well as data on the convergence of the meridians and the direction correction figure - this information is especially important when making high-precision calculations. The drawing will show the relationship between these angular values to simplify the perception of this information. In the middle, as a rule, the numerical and linear scales of the topographic map are placed, and the scale value and height of the relief section are also indicated. In the lower right corner there is a depth scale, which is designed to calculate the steepness of the slopes. It also indicates when and using what method the map was created.
Thirdly, between the outer and inner frames of the map there is a digitization of the horizontal and vertical lines of the coordinate network. The geographical coordinates - latitude and longitude - of the corners of the frame are also inscribed there. With this visual grid, determining coordinates becomes much easier and more accessible. In addition, the frame is divided into minute divisions, and those, in turn, are divided into six equal segments of 10 seconds each - this system allows you to determine exact coordinates on a topographic map.
Fourthly, on the map at the exits of highways and railways the name of the nearest city, town or station in the direction of this route is given with a caption of the distance to this settlement (it is given in kilometers).
Finally, inside the frames are the proper names of villages, towns, and cities, which are only partially printed on the sheet.
Rules for working with topographic maps
Educational and educational goals:
1. Give the concept of symbols of topographic maps.
2. Instill initial skills in reading topographic maps.
3. Provide practical skills in using scales.
4. Introduce methods for determining distances using a topographic map.
5. Teach cadets to measure distances on a topographic map and determine the areas of individual sections of terrain.
6. To instill in cadets a sense of responsibility for the correct performance of practical work on measuring distances and determining the areas of terrain on a map.
7. During the lesson, instill in cadets attentiveness and ability to analyze the information received, and develop logical thinking.
Time: 2 hours (80 min.).
Place: auditorium as scheduled.
Method: lecture.
Educational and material support:
1. Literature: Psarev A.A. "Military Topography", ed. 1986 pp.109-139 and appendix 2, pp. XI-XXXIX;
2. Directory “Conventional signs of topographic maps”;
3. Posters “Topographical symbols”;
4. A set of educational topographic maps of various scales;
5. Personal computer, multimedia projector;
6. Measuring compasses, chord angle meters, simple pencils, officer’s rulers.
Methodological recommendations for preparing and conducting classes.
Preparing the teacher for the lesson.
When preparing for a lesson, the teacher must:
study and understand the educational issues of the topic and their connection with previously studied topics;
study this methodological development and the literature indicated in it;
draw up a lesson plan and submit it for approval to the head of the cycle;
prepare and check visual aids, topographic maps, etc., in accordance with the section “Educational and Material Support” of this methodological development.
Methodology for conducting the lesson
After the introductory part, in order to check the assimilation of the material covered on the previous topic, conduct a control survey within 8-10 minutes. For this purpose, distribute tasks to the students and announce the order of their completion. After the time for the test has ended, collect answers from the students and begin presenting the material on the topic of the lesson.
For the first educational question, talk about what topographic symbols are and what main groups all local objects are divided into when depicting them on topographic maps. Indicate that each group of local items has its own system of symbols.
Describe each type of symbol in detail, accompanying the story with drawings on the board and demonstrating them on posters and directly on maps.
When explaining off-scale conventional signs, require students to draw conventional symbols in their notes, mark their main points, which must be taken into account when measuring distances and coordinates.
Briefly describe the color design of the cards. Show on posters and maps.
Inform students that along with symbols on maps, signatures and digital symbols are used. In this case, full and abbreviated signatures are used, indicate in which cases. Show examples on maps of different scales.
Explain for what purpose digital symbols are used and confirm this with various examples on maps.
Briefly talk about the color design of the cards. Show on posters and topographic maps.
Next, tell us that along with symbols, signatures and digital symbols are used on maps. In this case, full and abbreviated signatures are used, indicate in which cases. Show examples on maps of different scales. The best daily rentals in Kyiv at reasonable prices can be found on the website roomer.kiev.ua
Explain the purpose of numerical symbols and support them with various examples on maps.
When teaching map reading, the teacher should ensure that students consider the image of local objects and relief not in isolation from each other, but in their entirety and connection, since only in this way can a complete picture of the entire area be obtained. The goal will be achieved if students develop the ability to 'transfer' space from map to terrain and back from terrain to map. Developing the thinking of students in this way in the process of reading a map, we must not forget that it should be based on a solid knowledge of conventional signs.
For a detailed study of the area, it is necessary to disclose the algorithm for determining the qualitative and quantitative characteristics of local objects in the process of reading the map.
Reviewing examples for each local subject together with the students, explain the sequence of studying qualitative and quantitative characteristics.
As an example for independent work, students can be asked, against a tactical background, to give an answer on assessing the terrain using a 1:50,000 scale map.
When considering the second educational question, repeat the definition of the map scale and show with practical examples that distances on the map are measured using usually a numerical or linear scale.
Using practical examples, show ways to determine areas and why use transparent palettes. Talk about the sources of errors on topographic maps and the accuracy of measuring distances and determining areas, which depends primarily on the scale of topographic maps.
Guidelines for the final part.
Remind the purpose of the lesson and draw a conclusion on the topic of the lesson. Note the importance of this lesson and the acquired skills for further practical use both in the process of training in military disciplines and in the future when performing their duties as a commander. Evaluate the work of cadets and announce grades. Announce the self-study task and answer the cadets’ questions.
Key definitions:
When creating topographic maps, the linear dimensions of all terrain objects projected onto a level surface are reduced by a certain number of times. The degree of this reduction is called the map scale. The map scale can be expressed in numerical form (numerical scale) or graphically (linear, transverse scales), in the form of a graph.
This simplifies the process of measuring distances, since no calculations are required.
The transverse scale is a special graph engraved on a metal plate. Its construction is based on the proportionality of segments of parallel lines intersecting the sides of the angle.
Symbols of topographic maps
Requirements for symbols of topographic maps. Conventional signs are a system of graphic symbols designed to visually depict an area on a given scale and convey various characteristics of its elements.
With the help of conventional signs, the map shows terrain objects that are not expressed in its scale, but are important, and also highlights the main objects among the secondary ones.
One of the advantages of our topographic maps over maps of other countries is their advantage in completeness of content (for example, on topographic maps of the Republic of Belarus there are approximately twice as many symbols as on maps of the USA).
Conventional signs should be:
clearly distinguishable from each other, visual and expressive;
meaningful;
standard;
economical, beautiful and elegant.
Studying an area always begins with studying the topographic map that covers that area. The topographic map is a constant companion and guide for commanders of all levels and the main means of preliminary study of the area.
Therefore, the meaning of the symbols used when depicting local objects on topographic maps determines the ability of officers to read a topographic map and assess the terrain in the interests of the combat mission being performed by the unit.
The teacher, indicating the square of the coordinate grid, announces and shows on the map examples of images of local objects by type of symbols.
Map scale 1:50,000 U-42-85-A.
Scale symbols:
forest massif (4412, 3914), Istra River, Akhmovar forest, etc.
Off-scale symbols:
ferry crossing (3606), geodetic point with mark 174.3 (3909), Mogila farmstead (4907).
Explanatory symbols:
Characteristics of the forest (4908), the speed of the river and its name (4202), characteristics of the bridge (4715), characteristics of the road (4007), characteristics of the settlement of Zudna (4902), etc.
Forests, gardens, vineyards, shelterbelts (expressed on the map scale), and bushes are depicted in green.
Seas, rivers, lakes, wells, water sources, swamps, salt marshes, glaciers, as well as numbers and signs indicating the width and depth of rivers, waterfalls, rapids, piers, etc. are depicted in blue or light blue (turquoise).
The relief and its elements are depicted in brown (horizontals, rocks, cliffs, ravines, screes, gullies, as well as symbols of coastal ramparts, dry river beds, rocky placers, pebbles, sands).
Local objects, road networks, contours, explanatory captions, digital characteristics, except for relief and hydrography, are depicted in black.
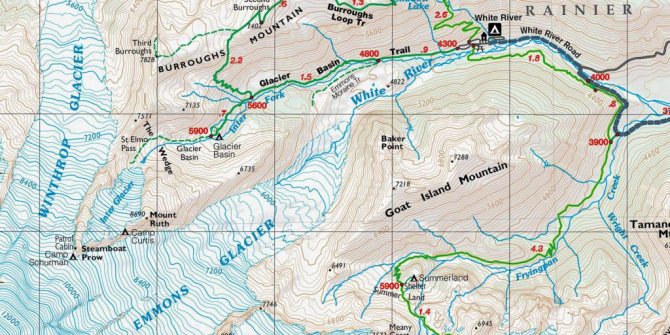
Reading topographic maps

Studying the territory using a topographic map includes determining the nature of the territory and the qualitative and quantitative characteristics of individual objects. Reading a map implies a complete and accurate perception of the symbolism of the symbols, as well as effective recognition from them of the types of objects depicted and their individual features. There are several methods for reading a topographic map, but they all contain similar steps.
First, there is an initial acquaintance with the map. Using the information located in the outer space, you can calculate the scale, study the height of the landscape section and check the time of creation of the map, finding out the relevance of the information provided. Knowing the scale and elevation of a landscape section will help you know the level of detail on a topographic map. Having information about the scale, you can quickly estimate the size of local objects and calculate the distance between them. These steps involve a very brief reading of the topographic map.
Next comes the stage of deeper and more detailed study. The rules for reading topographic maps involve the use of information about the declination of the magnetic needle and subsequent correction for direction. Knowing the correction, you can quickly calculate directional angles, converting them into magnetic azimuths or orienting the topographic along the kilometer grid line on the ground.
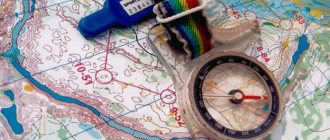
Orientation using a map
Orientation is a way of determining location by objects that appear around you. The use of topographic maps for orientation is the task of people in many professions.
Orientation has 3 main tasks:
- Recognition of the area by basic features and calculation of location, recognition of the direction of movement in a specific area.
- Calculation of the sides of the horizon and one’s location, tactical determination of location for military-strategic purposes.
- Approximate calculation of the location and direction of movement, as well as calculation of the time to reach a certain point.

Orientation using a topographic map is considered one of the main ways to solve problems.
Determining geographic coordinates on a topographic map
Geographic coordinates are width and longitude; they facilitate calculations for the location of a specific object on the surface of the earth, based on a coordinate system. Topographic type maps are those maps that are covered with frame grids. The meridians are the east and west directions, and the north and south frames are parallels.
To calculate the geographic coordinates of a specified point, find a parallel and meridian located close to it.
The cartographic image grid is divided into minutes with a minimum of 10 seconds. The frames on the sides are taken as an indicator of the corresponding latitude, and the top and bottom sides are taken as longitude.
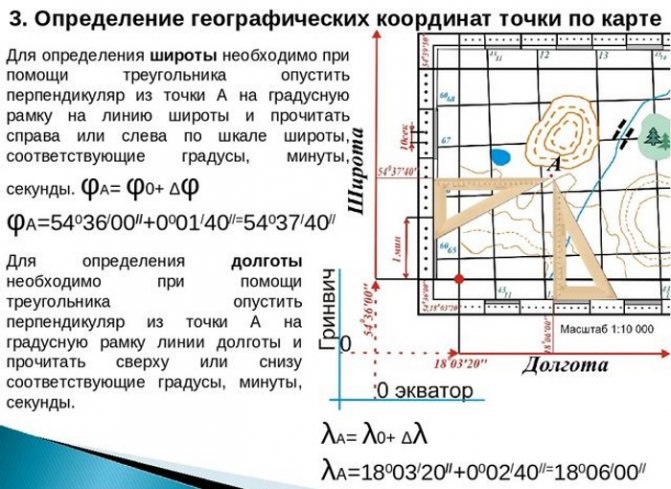
To calculate geographic coordinates, measure the distance from a specific point to the southern side of the frame, then apply an equal segment of a measuring compass on the other side and set the minutes in a specific time period. The minute indicators are added to the determined indicators of the southwestern corner of the grid, thus obtaining the latitude.
Longitude is also measured, while the indicators on the other side of the frame, which symbolizes the coordinate system, are measured. The method of calculating coordinates from topographic maps is often used for military-strategic purposes. Determining the location by width and longitude allows you to accurately determine the location of the object.
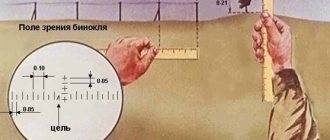
Measuring distances on a map
To calculate distances, maps with refinements of numerical and linear scales are used:
- Straight lines. A ruler is used for fixation. The indicator obtained as a result of the measurement is multiplied by the scale value of a particular map.
- To measure the values of indirect segments, a compass is used . The indicator is multiplied by the scale mark, taking into account a coefficient that allows fluctuations due to the nature of the terrain.
- Curved lines of a sinuous type . A curvimeter is suitable for measurement. This is a device that consists of a wheel connected to a dial along which a sensitive hand moves. As the wheel moves across the territory shown on the map, the arrow begins to oscillate to indicate the desired distance. It is expressed in centimeters. Before starting measurements, the curvimeter indicator is set to position “0”. The result is multiplied by a value corresponding to the map scale. The resulting value is the distance in the designated area that needed to be measured.
- Squares . The area of a specific object is calculated using the squares of the coordinate grid. Straight lines will show more accurate results than curved lines.
Specialist cartographers point out that measuring distances in mountainous areas is made difficult by the discrepancy in heights. To increase the accuracy of measurements, special coefficients are adopted that take into account the nature of the terrain and the scaling scale.
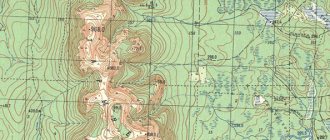
Relief characteristics
To characterize the relief depicted on a topographic map, use the available data:
- Absolute altitude is a segment from ocean level to a point on the earth's surface.
- Relative altitude is an indicator that reflects the difference between one point above sea level and another.
- The relief section is the difference between 2 adjacent heights.
The cross-section of the relief is determined by the map scale, and also depends on the type of relief. It is expressed as a numerical value in the map legend. To understand the characteristics of the terrain, it is necessary to take into account the presence of ascents and descents. In addition, the directions of river flow, which are indicated by black arrows on topographic maps, are important.
Taking into account the listed indicators, changes in the characteristics of the relief and the difference between relative heights in the proposed areas are identified using a topographic map.
Determining the steepness of the slope
The steepness of the slope is the angle of inclination. Using a cartographic image, in which the relief is depicted using the contour lines method, and is also combined with height indicators, you can find the steepness of the slope at given marks. The direction of the slope is graphically described by perpendicular horizontal lines and expresses its greatest steepness.
As a rule, tasks to identify the steepness of a slope are accompanied by indicating 2 points on the map. A connecting line is drawn between them. Its type depends on the type of horizontal. The line intersects adjacent parts at an angle of 90°, this determines the direction of the steepness.
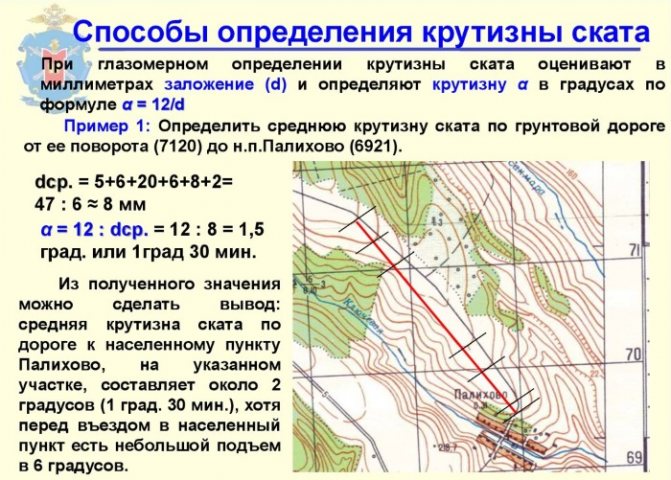
The numerical value of the slope steepness is calculated according to the established depth scale. With minimal estimates of the location, the slope is depicted as flat. The pitch scale is a numerical expression indicating the slope using a degree measure.
To calculate it, measure the segment from one adjacent horizontal line to another in the same direction.
Then mark the same segment on the placement scale using a compass. The indicator on the scale that will be opposite the delayed segment is the steepness of the slope in degrees. Using a topographic map is a necessity when you need to study the relief in a proposed area or calculate the geographic coordinates of the location of a given object.
Topography is a science that is actively developing along with the improvement of computer technology. They help increase the accuracy of indicators and eliminate the error of the information provided.
Article design: Oleg Lozinsky