The concept of scale and its types
Map scale is the ratio of the length of a segment on the map to its actual length on the ground.
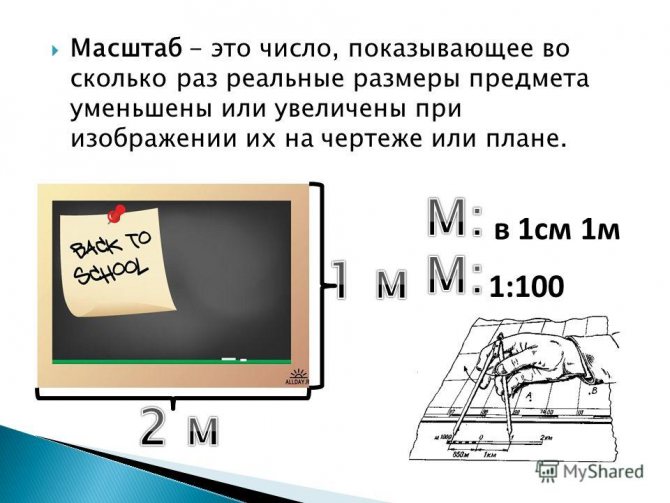
Scale (from the German Stab - stick) is the ratio of the length of a segment on a map, plan, aerial or satellite image to its actual length on the ground.
Let's consider the types of scales.
Numerical scale
This is a scale expressed as a fraction, where the numerator is one and the denominator is a number indicating how many times the image is reduced.
Numerical scale is a scale expressed as a fraction in which:
- the numerator is equal to one,
- the denominator is equal to the number showing how many times the linear dimensions on the map are reduced.
Named (verbal) scale
This is a type of scale, a verbal indication of what distance on the ground corresponds to 1 cm on a map, plan, photograph.
A named scale is expressed by named numbers indicating the lengths of mutually corresponding segments on the map and in nature.
For example, there are 5 kilometers in 1 centimeter (5 kilometers in 1 cm).
Linear scale
This is an auxiliary measuring ruler applied to maps to facilitate the measurement of distances.
Plan scale and map scale
The scale of the plan is the same at all its points.
The map scale at each point has its own particular value, depending on the latitude and longitude of the given point. Therefore, its strict numerical characteristic is the numerical scale - the ratio of the length of an infinitesimal segment D on the map to the length of the corresponding infinitesimal segment on the surface of the ellipsoid of the globe.
However, for practical measurements on a map, its main scale is used.
Scale and detail of maps
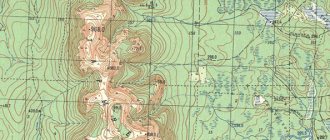
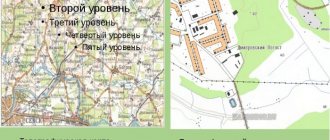
Large-scale maps make it possible to convey objects as large and accurately as possible, while when the scale decreases, generalization of the contours of objects, grouping of objects, or exclusion of the smallest of them becomes a natural need. Cartographic images are detailed and accurate at a scale of $1:1000000$ or larger. To clearly see the difference in detail on maps of different scales, just look at the display of the city on several maps. So on a map of scale $1:1000\000$ the city will be shown as a non-scale symbol, while scale $1:10000$ allows you to accurately display individual buildings and their configuration.
Have questions about this topic? Ask a question to the teacher and get an answer in 15 minutes! Ask a Question
Forms of expression of scale
The designation of scale on maps and plans has three forms - numerical, named and linear scales.
The numerical scale is expressed as a fraction in which:
- numerator is one,
- denominator M – a number showing how many times the dimensions on the map or plan are reduced (1:M)
In Russia, standard numerical scales have been adopted for topographic maps
- 1:1 000 000
- 1:500 000
- 1:300 000
- 1:200 000
- 1:100 000
- 1:50 000
- 1:25 000
- 1:10 000
- For special purposes, topographic maps are also created at scales of 1:5,000 and 1:2,000
Main scales of topographic plans in Russia
- 1:5000
- 1:2000
- 1:1000
- 1:500
In land management practice, land use plans are most often drawn up at scales of 1:10,000 and 1:25,000 , and sometimes - 1:50,000.
When comparing different numerical scales, the smaller one is the one with the larger denominator M , and, conversely, the smaller the denominator M , the larger the scale of the plan or map.
Thus, a scale of 1:10000 is larger than a scale of 1:100000 , and a scale of 1:50000 is smaller than a scale of 1:10000 .
Note
The scales used in topographic maps are established by the Order of the Ministry of Economic Development of the Russian Federation “On approval of requirements for state topographic maps and state topographic plans, including requirements for the composition of information displayed on them, for the symbols of this information, requirements for the accuracy of state topographic maps and state topographic plans , to the format of their presentation in electronic form, requirements for the content of topographic maps, including relief maps” (No. 271 of June 6, 2020, as amended on December 11, 2020).
Features of calculations
So, you need to present some kind of drawing, plan or detail. How to do this with the least amount of time and most accurately? For this you need: a house project, an image of buildings on a map or plan, a drawing of parts, a calculator, and drawing supplies.
It is most convenient to draw objects, three-dimensional parts or objects using a 1:1 ratio. This means that the meter of the real terrain is proportional to the centimeter in the figure. But most often there is a need to apply scales of a different order, such as 1:2,1:10 and so on. This happens if the territory is large, but it needs to be depicted compactly. If the object is very tiny, but even the smallest details are important during production, it is depicted using a scale of 10:1 or even higher.
Scale accuracy
The maximum possibility of measuring and constructing segments on maps and plans is limited to 0.01 cm. The corresponding number of meters of terrain on the scale of a map or plan represents the maximum graphic accuracy of a given scale.
Since the accuracy of the scale expresses the length of the horizontal location of the terrain line in meters, to determine it, the denominator of the numerical scale should be divided by 10,000 (1 m contains 10,000 segments of 0.01 cm). So, for a map at a scale of 1:25,000, the scale accuracy is 2.5 m; for a 1:100,000 map - 10 m, etc.
Scales of topographic maps
| numerical map scale | card name | 1 cm on the map corresponds to a distance on the ground | 1 cm2 on the map corresponds to an area on the ground |
| 1:5 000 | five thousandth | 50 m | 0.25 ha |
| 1:10 000 | ten-thousandth | 100 m | 1 ha |
| 1:25 000 | twenty-five thousandth | 250 m | 6.25 ha |
| 1:50 000 | fifty thousandth | 500 m | 25 hectares |
| 1:1100 000 | hundred thousandth | 1 km | 1 km2 |
| 1:200 000 | two hundred thousandth | 2 km | 4 km2 |
| 1:500 000 | five hundred thousandth, or half a millionth | 5 km | 25 km2 |
| 1:1000000 | millionth | 10 km | 100 km2 |
Below are the numerical scales of the maps and the corresponding named scales:
Scale 1:100,000
- 1 mm on the map – 100 m (0.1 km) on the ground
- 1 cm on the map – 1000 m (1 km) on the ground
- 10 cm on the map – 10,000 m (10 km) on the ground
Scale 1:10000
- 1 mm on the map – 10 m (0.01 km) on the ground
- 1 cm on the map – 100 m (0.1 km) on the ground
- 10 cm on the map – 1000 m (1 km) on the ground
Scale 1:5000
- 1 mm on the map – 5 m (0.005 km) on the ground
- 1 cm on the map – 50 m (0.05 km) on the ground
- 10 cm on the map – 500 m (0.5 km) on the ground
Scale 1:2000
- 1 mm on the map – 2 m (0.002 km) on the ground
- 1 cm on the map – 20 m (0.02 km) on the ground
- 10 cm on the map – 200 m (0.2 km) on the ground
Scale 1:1000
- 1 mm on the map – 100 cm (1 m) on the ground
- 1 cm on the map – 1000 cm (10 m) on the ground
- 10 cm on the map – 100 m on the ground
Scale 1:500
- 1 mm on the map – 50 cm (0.5 m) on the ground
- 1 cm on the map – 5 m on the ground
- 10 cm on the map – 50 m on the ground
Scale 1:200
- 1 mm on the map – 0.2 m (20 cm) on the ground
- 1 cm on the map – 2 m (200 cm) on the ground
- 10 cm on the map – 20 m (0.2 km) on the ground
Scale 1:100
- 1 mm on the map – 0.1 m (10 cm) on the ground
- 1 cm on the map – 1 m (100 cm) on the ground
- 10 cm on the map – 10 m (0.01 km) on the ground
Example 1
Convert the numerical scale of the map to a named one:
- 1:200 000
- 1:10 000 000
- 1:25 000
Solution:
To more easily convert a numerical scale into a named one, you need to count how many zeros the number in the denominator ends with.
For example, on a scale of 1:500,000, there are five zeros in the denominator after the number 5.
If after the number in the denominator there are five more zeros, then by covering (with a finger, a pen or simply crossing out) the five zeros, we get the number of kilometers on the ground corresponding to 1 centimeter on the map.
Example for scale 1:500,000
The denominator after the number has five zeros. Closing them, we get for a named scale: 1 cm on the map is 5 kilometers on the ground.
If there are less than five zeros after the number in the denominator, then by closing two zeros, we get the number of meters on the ground corresponding to 1 centimeter on the map.
we close two zeros in the denominator of a scale of 1:10,000
in 1 cm – 100 m.
Answers:
- 1 cm – 2 km
- 1 cm – 100 km
- in 1 cm – 250 m
Use a ruler and place it on the maps to make it easier to measure distances.
Example 2
Convert the named scale to a numerical one:
- in 1 cm – 500 m
- 1 cm – 10 km
- 1 cm – 250 km
Solution:
To more easily convert a named scale to a numerical one, you need to convert the distance on the ground indicated in the named scale into centimeters.
If the distance on the ground is expressed in meters, then to obtain the denominator of the numerical scale, you need to assign two zeros, if in kilometers, then five zeros.
For example, for a named scale of 1 cm - 100 m, the distance on the ground is expressed in meters, so for the numerical scale we assign two zeros and get: 1:10 000.
For a scale of 1 cm - 5 km, we add five zeros to the five and get: 1:500 000.
Answers:
- 1:50 000
- 1:1 000 000
- 1:25 000 000
Types of maps depending on scale
Depending on the scale, maps are conventionally divided into the following types:
- topographic plans 1:400 – 1:5 000
- large-scale topographic maps 1:10,000 – 1:100,000
- medium-scale topographic maps from 1:200,000 – 1:1,000,000
- small-scale topographic maps less than 1:1,000,000
Types of maps depending on scale
Depending on the scale, maps are divided into:
- Large-scale – scale $1:100\000$ or less. With the help of such maps, small states, administrative-territorial units or settlements are depicted.
- Medium-scale maps have scales ranging from $1:100\000$ to $1:1\000\000$. As a rule, these are maps of large states or natural objects - islands, peninsulas, seas.
- Small-scale maps . The scale of such maps is more than $1:1\000\000$. Such maps depict individual parts of the world, continents or the entire world.
Looking for ideas for study work on this subject? Ask a question to the teacher and get an answer in 15 minutes! Ask a Question
In the name of the scale type, coarseness indicates how large objects are displayed. Those. on a small-scale map, entire countries will appear small in area, and vice versa, on a large-scale map, objects are depicted larger.
Note 2
Regarding the numerical recording of the scale, the following logical rule applies: the larger the number on the right side of the fraction, the smaller the scale.
Topographic map
Topographical maps are those whose content allows them to solve various technical problems.
Maps are either the result of direct topographic survey of the area, or are compiled from existing cartographic materials.
The terrain on the map is depicted at a certain scale.
The smaller the denominator of a numerical scale, the larger the scale. Plans are drawn up on a large scale, and maps are drawn up on a small scale.
Maps take into account the “spherical shape” of the earth, but plans do not. Because of this, plans are not drawn up for areas larger than 400 km² (that is, areas of land approximately 20 km x 20 km).
- Standard scales for topographic maps
The following scales of topographic maps are accepted in our country:
- 1:1 000 000
- 1:500 000
- 1:200 000
- 1:100 000
- 1:50 000
- 1:25 000
- 1:10 000
This series of scales is called standard. Previously, this series included scales of 1:300,000, 1:5000 and 1:2000.
- Large scale topographic maps
Scale maps:
- 1:10,000 (1cm =100m)
- 1:25,000 (1cm = 100m)
- 1:50,000 (1cm = 500m)
- 1:100,000 (1cm =1000 m)
are called large-scale.
- Other scales and maps
Topographic maps of the territory of Russia up to a scale of 1:50,000 inclusive are classified, topographic maps of a scale of 1:100,000 are chipboard (for official use), and smaller ones are not classified.
Currently, there is a methodology for creating topographic maps and plans of any scale that are not classified and intended for public use.
| Map scale | Scale value | Card name |
| 1: 10 000 | 100 m | Ten-thousandth |
| 1: 25 000 | 250 m | Twenty-five thousandth |
| 1: 50 000 | 500 m | Fifty thousandth |
| 1: 100 000 | 1 km | One hundred thousandth |
| 1: 200 000 | 2 km | Two hundred thousandth |
| 1: 500 000 | 5 km | Five hundred thousandth |
| 1: 1 000 000 | 10 km | Millionth |
A map at a scale of 1:25,000 is used by troops to study the most important boundaries and terrain (sections of rivers, landing areas, large cities, etc.), to carry out measurements and calculations in the design and construction of military engineering structures.
A 1:50,000 topographic map is used to study and evaluate the terrain in areas of landing and combat operations, terrain orientation, organization and alignment of elements of artillery battle formations, deployment and camouflage of troops, and terrain engineering equipment.
Topographic map 1:100,000 - the main map for the troops. It is used by commanders and staffs of units and subunits for planning and organizing landings and combat, studying and assessing the terrain in landing areas, orientation, target designation and control of units in combat.
A topographic map at a scale of 1:200,000 is intended for planning and organizing the march of units, studying and assessing the terrain when planning and preparing combat operations, and commanding troops in battle.
Topographic maps of scales 1:500,000 and 1:1000,000 are intended for the development of operations, study and assessment of the general nature of the terrain during the preparation and conduct of operations.
Along with topographic maps, the airborne forces can also use some special maps designed for a detailed study of the terrain and its individual elements to plan combat operations, assess the terrain and enemy objects in the area. These are city plans 1:10000 and 1:2,000, maps of terrain changes (promptly corrected maps) 1:100,000; reconnaissance maps, 1:100,000, encoded maps, 1:200,000, to ensure covert command and control of troops; 1:100,000 geodetic data maps with imprinted coordinates of contour points for artillery units; maps of river sections 1:25,000 and 1:50,000 for engineering units, photographic diagrams 1:5,000 and 1:10,000 landing sites.
8.3.2. Working with a topographic map on the ground
Orientation on a map by comparing it with the terrain is the main way of orientation. The use of navigation equipment on combat vehicles and portable GPS navigation receivers only partially automates the process of terrain orientation, without completely replacing the map.
Map orientation includes orienting the map, comparing it with the terrain using identified landmarks and determining your location (standing point).
Map orientation. To orient a map means to position it horizontally so that the north (top) side of the map frame faces north. Posted on ref.rf In this case, the location of local objects and landforms on the ground will correspond to the location of symbols on the map.
The map should be oriented according to a linear landmark and the direction to the landmark when one’s location is known from the map, and according to a compass when the standing point is not known.
According to a linear landmark, the map should be oriented approximately or accurately.
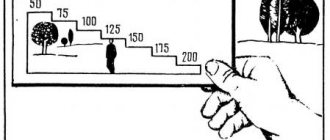
For approximate orientation
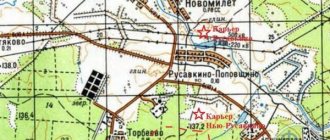
It is enough to rotate the map so that the direction mentally drawn from the standing point along the conventional sign of a linear landmark on the map, for example, a road, coincides with the direction of this landmark on the ground (Fig. 8.16).

Rice. 8.16. Orienting the map according to a linear landmark
Approximate orientation of the map is usually carried out on the march, when, when comparing the map with the terrain, the passage of pre-designated landmarks is controlled - settlements, bridges, intersections and forks in roads, power lines and other characteristic objects. Your location on the map does not need to be determined with high accuracy and is done approximately by eye.
For precise orientation
cards use a ruler or pencil. By applying a ruler to a conventional sign of a linear landmark, for example, a road, its direction is aligned with the direction of this landmark on the ground. Next, they check whether all local objects and landforms located on the ground to the right and left of the road have the same location on the map. If this condition is met, the map is oriented correctly.
The map is oriented in the direction of the landmark in the same way as in the direction of the linear landmark. The only difference is that instead of a linear landmark, they use the direction from the standing point to some distant object (a separate tree, bridge, etc.), reliably identified on the ground and on the map.
Precise orientation of the map in the direction of a distant local object (landmark) is carried out using a ruler or pencil. The ruler is applied on the map with its side edge to the standing point and the symbol of the object in the direction towards which the map is oriented. Next, turn the map horizontally so that the object on the ground is on the line of sight. In this position, the map will be oriented accurately (Fig. 8.17).
Fig.8.17. Orienting the map towards a landmark
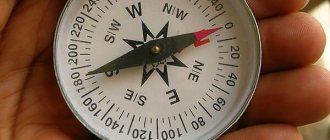
Orienting the map using a compass is used in closed areas, when your location is unknown or landmarks are not visible from your standing point, as well as when you encounter diverging roads along the way and choose the direction of movement.
When orienting the map approximately, the direction to the north is determined using a compass, then the map is turned with the upper side of its frame in this direction.
When accurately orienting a map using a compass, the compass reference pointer is set opposite the scale division equal to the direction correction. If the direction correction is positive, the reference pointer is set to the right of the zero scale division (clockwise), if negative - to the left (counterclockwise). Next, the compass is installed on the map with a zero diameter (north-south) on any of the vertical lines of the map grid and a zero reading towards the upper (north) side of the map frame. Without changing the position of the compass, turn the map in a horizontal plane until the northern end of the arrow is set against a reference equal to the established direction correction.
If the compass interferes with working on the map, for example, when making notches, the map can be oriented taking into account the magnetic declination, then the value of the magnetic declination is set on the compass scale, and the compass is installed on one of the inner sides of the map frame. Next, the procedure for orienting the map is the same as in the previous method (Fig. 8.18).
Fig.8.18. Orienting the map using a compass:
a – the compass is installed on a vertical grid line; b – the compass is installed on the side (western) side of the map frame
If the direction correction or magnetic declination value is less than 3°, i.e. equal to the compass scale division, it is not taken into account when orienting the map.
Orientation of the map always precedes any work with the map on the ground; therefore, both the time spent on the types of work performed with the map and the accuracy with which they will ultimately be performed depend on its thoroughness.
A tale about a map on a scale of 1:1
Once upon a time there lived a Capricious King. One day he traveled around his kingdom and saw how large and beautiful his land was. He saw winding rivers, huge lakes, high mountains and wonderful cities. He became proud of his possessions and wanted the whole world to know about them.
And so, the Capricious King ordered cartographers to create a map of the kingdom. The cartographers worked for a whole year and finally presented the King with a wonderful map, on which all the mountain ranges, large cities and large lakes and rivers were marked.
However, the Capricious King was not satisfied. He wanted to see on the map not only the outlines of mountain ranges, but also an image of each mountain peak. Not only large cities, but also small ones and villages. He wanted to see small rivers flowing into rivers.
The cartographers set to work again, worked for many years and drew another map, twice the size of the previous one. But now the King wanted the map to show passes between mountain peaks, small lakes in the forests, streams, and peasant houses on the outskirts of villages. Cartographers drew more and more maps.
The Capricious King died before the work was completed. The heirs, one after another, ascended the throne and died in turn, and the map was drawn up and drawn up. Each king hired new cartographers to map the kingdom, but each time he was dissatisfied with the fruits of his labor, finding the map insufficiently detailed.
Finally, the cartographers drew the Incredible Map! It depicted the entire kingdom in great detail - and was exactly the same size as the kingdom itself. Now no one could tell the difference between the map and the kingdom.
Where were the Capricious Kings going to keep their wonderful map? The casket is not enough for such a map. You will need a huge room like a hangar, and in it the map will lie in many layers. But is such a card necessary? After all, a life-size map can be successfully replaced by the terrain itself))))
It is useful to familiarize yourself with this
- You can familiarize yourself with the units of measurement of land areas used in Russia here.
- For those who are interested in the possibility of increasing the area of land plots for individual housing construction, private household plots, gardening, vegetable farming, owned, it is useful to familiarize yourself with the procedure for registering additions.
- From January 1, 2020, the exact boundaries of the plot must be recorded in the cadastral passport, since it will simply be impossible to buy, sell, mortgage or donate land without an accurate description of the boundaries. This is regulated by amendments to the Land Code. A total revision of borders at the initiative of municipalities began on June 1, 2020.
- On March 1, 2020, the new Federal Law “On Amendments to the Land Code of the Russian Federation and certain legislative acts of the Russian Federation” (N 171-FZ dated June 23, 2014) came into force, according to which, in particular, the procedure for purchasing land plots has been simplified from municipalities. You can familiarize yourself with the main provisions of the law here.
- With regard to the registration of houses, bathhouses, garages and other buildings on land plots owned by citizens, the new dacha amnesty will improve the situation.
Topographic maps and their purpose. Large-scale series of topographic maps.
A topographic map is the main geographical document about an area containing an accurate, detailed and visual image of local objects and relief. Topographic maps are widely used by troops to solve a wide variety of problems. Using them, we can quickly study and evaluate the terrain over large areas, regardless of how far away the area being studied is from us and whether it is occupied by the enemy.
Using maps, they solve problems related to determining distances, angles and areas, heights, exceeding the mutual visibility of terrain points, steepness and types of slopes, etc.
The commander of small units most often uses maps at a scale of 1:100,000 to solve their problems in battle.
A 1:500,000 scale map is intended for detailed study and assessment of the terrain, orientation on it, making measurements and calculations that require the highest accuracy.
In some cases, a larger scale map of 1:25000 can be used to solve the same problems.
A map of scale 1:100000 is the main map for the troops. It is widely used for studying and assessing terrain, navigating it, targeting and controlling units in battle.
The following scale range is established for topographic maps of the CIS:
| Map scale | Scale value | Card name |
| 1:10000 1:25000 1:50000 1:100000 1:200000 1:500000 1:1000000 | 100 m 250 m 500 m 1 km 2 km 5 km 10 km | Decimal Twenty-five thousandth Fifty thousandth One hundred thousandth Two hundred thousandth Five hundred thousandth Millionth |
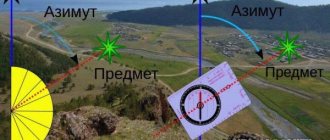
17. Methods for determining the cardinal directions by local objects and celestial bodies.
a) Determination of the sides of the horizon by the Sun
An approximate determination of the sides of the horizon based on the Sun is made taking into account the definition. In this case, we assume that the Sun is approximately located in the northern hemisphere:
- at 7 o'clock (maternity time) - in the east;
- at 13 o'clock - in the south;
- at 19 o'clock - in the west;
- at 1 o'clock - in the north.
The average movement of the Sun during 1 hour is 150.
For example, the time is 15 o'clock. To determine the direction to the north, 15 o'clock means 2 hours after noon. In 2 hours the Sun moved from the direction south to 300 to the right 2x150. This means that the noon line runs 300 to the left of the direction to the Sun at the moment, and the direction to the north is opposite to it.
According to the Sun using a clock, it is performed as follows. Holding the watch in a horizontal position, turn it so that the tip of the hour hand is directed towards the Sun. The straight line dividing the angle between the hour hand and the direction from the center of the clock to number 1 of the dial will indicate the direction to the south. To increase the accuracy of determining the sides of the horizon using this method in the southern regions, you can use a slightly modified technique:
- the clock is given not a horizontal, but an inclined position (for a latitude of 50-400 - at an angle of 40-500 to the horizon), while the clock is held with the number 1 away from you;
- having found the middle of the arc on the dial between the hour hand and the number 1, place a match here, i.e. perpendicular to the dial;
- without changing the position of the watch, they turn together with it in relation to the Sun so that the shadow of the match passes through the center of the dial.
At this moment, number 1 will be facing south.
Determining the sides of the horizon using a watch (method 1)
Determining the sides of the horizon using a clock (method 2)
b) according to the North Star
In practice, for the simplest definitions, it is assumed that the North Star is in the direction of the north (deviation about 10).
The location of the North Star is determined by the constellation Ursa Major: mentally continue the straight line passing through the two outermost stars of the “bucket” (α and β), and mark on it a distance equal to five times the apparent distance between these two stars. Here is the North Star, which is recognized by its brightness: it is brighter than all the stars surrounding it and is approximately equal in brightness to the stars of the constellation Ursa Major. In addition, Polaris is the terminal star of the handle of the “bucket” of the Ursa Minor constellation.
Finding the North Star.
c) on the moon
The essence of lunar orientation is that the direction to the Sun, hidden behind the horizon at night, is first determined, and then the sides of the horizon are found in this direction, taking into account time, in the manner described in paragraph a).
The horizontal angles between the directions to the Moon and the Sun are approximately 1800 for the full visible disk of the Moon (full moon), and 900 for the visible half of the Moon's disk (first and last quarters). In this case, the direction to the Sun passes from the side of the convexity of the visible part of the Moon.
If the visible part of the Moon is more than half, then the horizontal angle between the directions to the Moon and the Sun is greater than 900. If the visible part of the Moon is less than half, then this angle is less than 900. Approximately, it can be assumed that the value of the angle changes in direct proportion to the change in the visible part of the Moon.
Orientation by the Moon.
d) based on the characteristics of local objects
signs determined by the location of objects in relation to the Sun:
- the bark of most trees is rougher to the north, thinner, more elastic (birch is lighter) to the south;
- in pine, the secondary (brown, cracked) bark on the north side rises higher along the trunk;
- on the north side, trees, stones, wooden, tiled and slate roofs are covered with lichens and fungi earlier and more abundantly;
- on coniferous trees, resin accumulates more abundantly on the south side;
— anthills are located on the southern side of trees, stumps, bushes, in addition, the southern slope of anthills is flat, and the northern slope is steep;
— in spring, the grass cover is more developed on the northern outskirts of the meadows, warmed by the sun's rays, and in the hot period of summer - on the southern, shaded ones;
- berries and fruits acquire the color of maturity earlier (turn red, turn yellow) on the south side;
— in summer, the soil near large stones, buildings, trees and bushes is drier on the south side, which can be determined by touch;
— snow melts faster on the southern slopes, as a result of thawing, jagged “spikes” are formed on the snow, directed to the south;
— in the mountains, oak often grows on the southern slopes.
Other signs:
the altars of Orthodox churches, chapels and Lutheran kirks face east, and the main entrances are located on the west side;
— the altars of Catholic churches (cathedrals) face west;
- the raised end of the lower crossbar of the church cross faces north;
- idols (pagan chapels with idols) face south;
— clearings in large forest areas, as a rule, are oriented in a north-south and west-east direction; The numbering of forest blocks goes from west to east and further to the south.
Due to the fact that, under the influence of various reasons, in reality there are many deviations from the listed rules, when orienting it is necessary to take into account not one, but several signs.
Map scale, types of scales.
When drawing up plans and maps, horizontal projections of terrain lines are reduced by a certain number of times depending on the accuracy requirements for maps (plans).
Map scale is the degree to which a line on a map or plan is reduced relative to the horizontal location of the corresponding line on the ground.
When working with a map, plans or aerial photographs of the area, different scales are used: numerical or graphic (linear, proportional, transverse).
Determining distances using a numerical scale
Numerical scale
- length scale, expressed by an abstract number, in which the numerator is one, and the denominator is a number showing how many times the linear dimensions of the map are reduced:
where d
— length of the line on the map;
M -
map scale denominator;
D
- the horizontal length of this line on the ground.
The scale of a map or plan determines the detail of the depiction of terrain elements on them. The greater the value of the denominator of the numerical scale M,
the greater the degree of reduction in horizontal projections of terrain lines, the smaller the scale of the plan or map and the less detailed the terrain elements are depicted.
And vice versa, the smaller the denominator M
, the larger the scale will be, the more detail and detail the terrain elements can be shown on them.
For example, a numerical scale of 1:50,000 is smaller than a scale of 1:25,000, but larger than a scale of 1:100,000.
For convenience, the denominator of the numerical scale is taken to be equal to a round number: 1:500, 1:1,000, 1:2,000, 1:5,000 and 1:10,000 - for plans, 1:25,000, 1:50,000, 1:100 000, 1:200,000, 1:500,000, 1:1,000,000 - for topographic maps. The indicated relationships show that horizontal projections of terrain lines are reduced respectively by 500, 1000, 2000 times, etc., that is, a segment of 1 cm on the plan corresponds to a length of 500 cm or 5 m on the ground; 1000 cm or 10 m; 2000 cm or 20 m, etc.
The distance on the ground in meters or kilometers corresponding to 1 cm of a map or plan is called the scale value. The numerical scale and scale value are placed under the south side of the map sheet frame.
The numerical scale is a dimensionless quantity, so it can be used when measuring in any linear units (meters, miles, etc.). Ratio value 1:M
remains valid for all lines of the plan or map. Therefore, the scale is a constant value.
The direct use of a numerical scale in practical work is associated with calculations that are necessary to move from horizontal projections of terrain lines to the corresponding lines of a plan or map, and vice versa.
When using a numerical scale, distances on a map or plan can be measured in centimeters with a ruler or curvimeter (see Chapter 2). The resulting number of centimeters is multiplied by the denominator of the scale.
For example, a line on the map d
=
13.14 cm, and the map scale is 1:100,000. Using the formula for the transition from map (plan) lines to horizontal projections of the corresponding terrain lines D = dM, we obtain D = 13.14-100,000 = 1314,000 cm = 13,140 m
=
=13.14 km.
To plot lines measured on the ground on a map or plan, use the equality
For example, D
=
3750m;
1:M = 1:50,000, then d =
3750:50,000 = 0.075m = 7.5 cm.
5.1.2. Measuring distances using graphic scales
Linear scale
is a graphic representation of a numerical scale in the form of a straight line with divisions for measuring distances. To construct a linear scale, a series of segments of equal length are laid out on a straight line, called the base of the linear scale (Fig. 5.1). The scale base usually corresponds to a whole number of kilometers or hundreds of meters.
To improve measurement accuracy, the first base is divided into smaller parts. For a map with a scale of 1:50,000 (Fig. 5.1), the smallest division on a linear scale will correspond to 50 m.
Measurements on a linear scale are made with a measuring compass (Fig. 5.2). When measuring, the compass should be held with one hand, tilted away from you so that both needles are clearly visible at the same time. And when using a linear scale to determine the length of a line taken from a map or plan, you need to place the right leg of the compass on one of the lines to the right of zero so that its second leg exactly coincides with the leftmost base of the scale.
By summing the readings along the right and left legs of the measuring compass, we obtain the required line length.
For example, in Fig. 5.2 the required distance of the line measured on the map will correspond to 1 km 250 m on the ground.
When measuring the lengths of large linear objects, when the spread of the legs of the compass is greater than the dimensions of the linear scale available on the map, the kilometer grid can be used as an “assistant”. The measuring compass solution is placed on one of the lines of the kilometer grid so that one of the needles falls on the crosshairs of the grid. Then, reducing the opening of the measuring compass, they move it from the crosshair to the next crosshair, counting kilometers to the size when a linear map scale can be used.
Proportional scale
- graphic scale in the form of an angle divided by a system of equidistant parallel lines. It is used in cases where it is necessary to work with a stopographic map and an aerial photograph of the area simultaneously, in particular when interpreting aerial photographs and plotting objects from an aerial photograph on a topographic map.
To increase the accuracy of measuring line lengths on maps (plans), a transverse scale is used.
Transverse scale
is a combination of linear and proportional scales.
Transverse scales are manufactured in factories. They are engraved using dividing machines on special metal rulers called scales, as well as on the rulers of topographic instruments.
Labels on these scales are given in centimeters. Digitization of a transverse scale is carried out in the same way as a linear one - in accordance with the numerical scale.
A transverse scale, the base of which is 2 cm, and the remaining divisions are equal to tenths and hundredths of the base, is called a normal transverse scale (Fig. 5.3). The smallest division of a transverse scale with a base of 2 cm is equal to 0.02 cm. If the base of a transverse scale is taken to be 1 cm, then its smallest division will be equal to 0.01 cm.
Measuring distances using a transverse scale begins with determining the value of its divisions in relation to a given numerical scale, that is, they understand how many kilometers or meters are contained in the whole base, as well as in its tenth and hundredths.
Each line drawn on a plan or map using a transverse scale is composed of three parts:
• the number of integer bases taken from the zero perpendicular to the right leg of the measuring compass;
• the number of small divisions (tenths of the base), taken from the zero perpendicular to the left leg of the measuring compass;
• hundredths of the base located between the vertical line and the transversal.
Rice. 5.3. Normal transverse scale
Similarly, you can solve the inverse problem: using the length of a segment on a map (plan), determine the length of the corresponding terrain line.
For example, it is required to plot a distance equal to 1360 m on a scale of 1:50,000. Since on this scale 1 cm corresponds to 500 m, then at one base of the normal transverse scale there will be 1000 m (2 -500), in one tenth
-
100 m (2 -50) and in one hundredth - 10 m (2 -5).
Set the compass opening at 1000 m so that the left leg of the measuring compass is at mark 0 of the transverse scale, and the right leg is at mark 1 (Fig. 5.3). Then move the left leg of the compass three small divisions to the left, which corresponds to 300 m. The remaining 60 m are added by moving the legs of the compass upward by six divisions so that its right needle slides along the vertical line of the 1st transverse scale, and the left
-
along the third inclined line.
The required compass solution (1000 + 300 +
60) is shown in Fig.
5.3. When using a transverse scale, you must ensure that the ends of both legs of the measuring compass are located on the same horizontal scale line.
In the same way, you can plot segments at any other map scale using a transverse scale.
For example, in Fig. 5.3, the distance to which this compass opening corresponds at a map scale of 1:100,000 is equal to 2720 m (2000 + 600 + 120).
Using a normal transverse scale, distances are set aside and measured to the nearest 0.2 mm, which corresponds to one hundredth of the base. If the position of the legs of the compass between the horizontal lines of the transverse scale is assessed by eye, then the distances can be plotted with an accuracy of 0.1 mm.
When measuring distances on topographic maps using a transverse scale, you can use the data in Table. 5.1.
| Table 5.2 | 1:25 000 | 1:50 000 | 1:100 000 | 1:200 000 | |
| Average error, m | 5-10 | 12-25 | 25-50 | 50-100 | 100-200 |
The values of average errors for various scales are given in Table. 5.2.
How to determine the steepness of slopes using a ruler or by eye.
On Soviet topographic maps, the standard section height for each scale is set such that a slope of 1 cm corresponds to a slope of about 1 degree. From the above formula it can be seen that the number of times the slope is less than one centimeter, the number of times the steepness of the slope is more than one degree. It follows that a slope of 1 mm corresponds to a slope of 10 degrees, a slope of 2 mm corresponds to 5 degrees, a slope of 5 mm corresponds to 2 degrees, and so on.
Based on materials from the book “Map and Compass are My Friends.” Klimenko A.I.