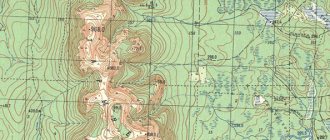
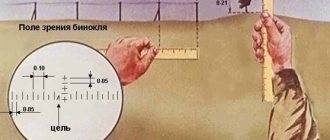
Topographic map concept
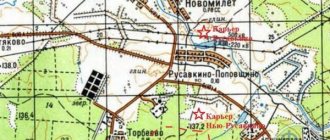
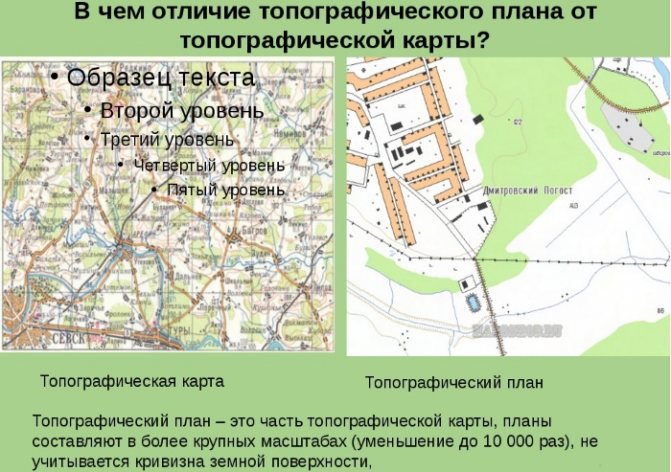
A topographic map is an image of an area at many times reduced scales.
They note:
- main points of geodesy or geology;
- relief features;
- hydrographic information;
- borders, roads;
- communications;
- important objects.
A topographic map is a way to display an area on paper for further orientation.
Topography deals with the study and compilation of images of geographical objects, based on survey materials from the air or from space. The main product of topography compiled by specialists is topographic maps. Topography controls the content of maps, the description of the rules for their compilation, as well as the introduction of additional changes over time.
The main methods used to compile maps:
- ground survey using geodetic devices;
- aerial photography;
- satellite imagery.
Modern methods of processing obtained images make it possible to make topographic maps as accurate as possible, close to reality. For this purpose, graphic processing is used, as well as the implementation of special computer programs.
The basic rule of mapping involves following a clear template, with detailed instructions regarding design style and scaling.
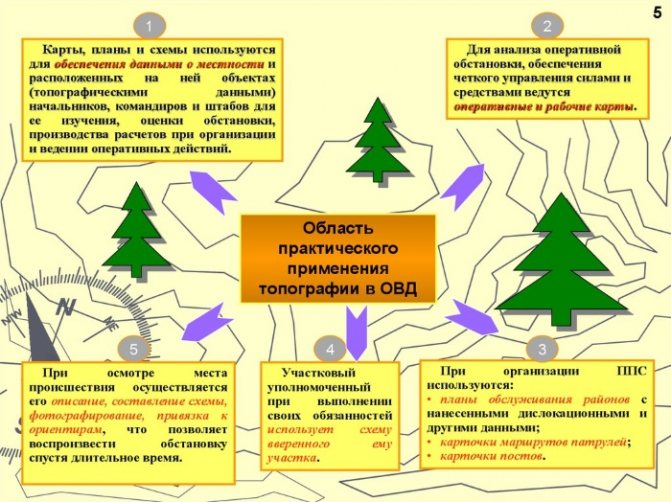
Areas of application of topographic maps:
- necessary in the military departments for planning strategic exercises in army units;
- used in construction for carrying out geodetic or geological work, as well as in the construction and planning of road surfaces;
- are used in agriculture in calculations regarding the placement of plantings and planning their care.

A topographic map is an item that is necessary during search and rescue operations, and is therefore often in demand by employees of the Ministry of Emergency Situations.
The first geographical maps
The first geographical maps appeared in the Stone Age. In ancient times, the Earth seemed huge to people. They gradually got to know her during their travels. A journey is a hike or voyage during which people, leaving their native places, visit new lands.
Primitive hunters and gatherers traveled long distances in search of food. The first geographers were travelers and seafarers. It was difficult for them; there were many obstacles on their difficult path. On small ships they boldly sailed into the open ocean, not knowing what awaited them tomorrow, in a week, in a month. They needed to know where the big river flowed, how to find a crossing across it, in which direction the swamps lay, where large herds of animals grazed. Drawings of the area helped them with this.
Returning, the travelers talked about what they managed to learn and see. You can describe the path in words, or you can draw the road, the shores that the travelers passed by, the mountains that stood in their way, rivers, forests and many other geographical objects. The main thing in the drawings was not a beautiful image of mountains and rivers, but their correct relative position, showing the distances between geographical objects. Thus, already in ancient times, plans and maps appeared - reduced conventional images of the earth’s surface on a plane. Ancient people painted them in caves, on stones, on birch bark, and on bone plates. The indigenous people of Australia, who lived before the arrival of Europeans in the Stone Age, could draw in the sand the terrain through which their tribe roamed.
It became much easier to travel when geographical maps appeared. But the first maps, compared to modern ones, were very primitive; they did not depict the entire Earth, but its individual parts, the most studied by people. They were still inaccurate, but they helped people better imagine the world around them and helped them during new travels. Conventional images - a special language of cards - were understandable to representatives of different nations who spoke different languages.
The oldest map
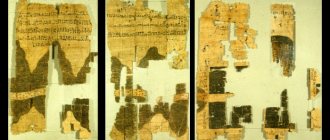
In Ukraine, a piece of mammoth tusk was found, on which a river is shown with two lines, a mountain slope is shown with strokes, and dwellings made from mammoth bones are drawn. This drawing is about 15 thousand years old. Using it as a map, archaeologists were able to find and excavate the dwellings depicted by ancient man.
Eratosthenes Map
One of the first maps was compiled before the beginning of the new era by the Greek scientist Eratosthenes (Fig. 1). It showed the populated part of the land around the Mediterranean (Inland) Sea: Southern Europe, Northern Africa and western Asia.
Ptolemy's Map
More perfect were the maps of the Greek scientist Ptolemy (Fig. 2), who lived in the 2nd century. n. e. A degree grid was already applied to them and a large number of geographical points were shown, all lands known to Europeans at that time. The lands around the Mediterranean Sea, which people knew well, are shown relatively accurately; the lands on the edge of the Ecumene are often incorrectly depicted. Land on maps occupied most of the globe.
On Ptolemy's map only part of the surface of our planet is visible. How many lands, how many more continents, islands, oceans and seas were to be discovered and mapped! People were waiting for the discovery of high mountains and mighty rivers, harsh northern ice and hot tropical forests. Ptolemy's maps were used for 14 centuries.
Behaim's Globe
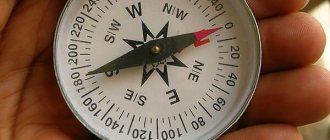
When traveling to distant countries, people navigated not only by the stars, compass and geographical maps, but also by globes. Globes were especially needed by sailors for sailing the oceans.
One of the first successful globes was created in the 15th century. German geographer Beheim. This globe was used not only by sailors, but also by cartographers when drawing up maps.
First atlas
At the end of the 15th century, the maps of the Dutchman Gerard Mercator were especially famous. Mercator named his set of maps “Atlas” in honor of the titan Atlas, the hero of ancient Greek myths, who held the firmament above the Earth and made globes. From now on, sets of maps are called atlases.
Classification of topographic maps
In each application area, a certain class of cards is used. As a rule, maps are classified according to two criteria: by scale and by main purpose.
Experts classify types of cards into separate classes:
- Overview . Includes engineering research materials that represent large areas of the globe. Most often, such maps are used to study geography, as well as scientific and reference material. They are convenient as a basis for studying and comparing several regions, and are also suitable in cases where high accuracy is not a priority.
- Military-strategic. These are materials that are often classified. The compilation of images is carried out by the discipline of military affairs - military topography.
- Land management . These are images created from engineering notes using specific data obtained from surveying or geological work.
Classification of cards
Before we consider in detail some types of geographical maps, we will understand the method of dividing them into groups. Classification is a system that connects all possible varieties ordered (by some characteristic). This systematization has several goals:
- inventory;
- storage;
- search;
- scientific systematization;
- compilation of lists and catalogues;
- creation of a data bank and cartographic information and reference systems.
As mentioned above, there are different principles for dividing the types of geographical maps. Classifying cards according to some of their characteristics is one of them.
These signs include:
- scale;
- subject;
- era of creation;
- language;
- method of registration;
- publication and so on.
Any systematization must satisfy certain requirements. These include the following:
- classification according to essential characteristics;
- sequential;
- one level – one base;
- full;
- backup system (this requirement implies the ability to include new types of cards).
Now we move on to a more detailed consideration of the types and types of maps that currently exist.
Classification by scale
A topographic map is a product of topography in which variation in dimensions is of great importance.
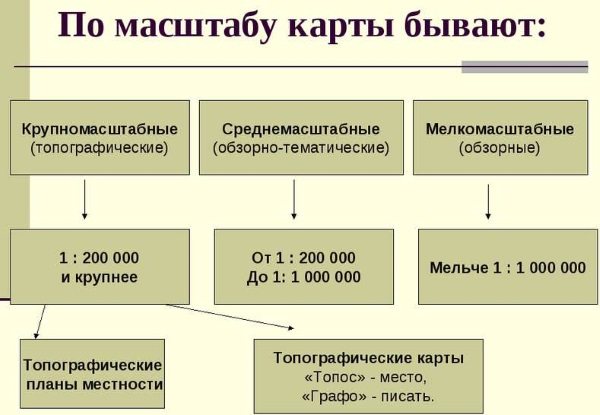
This principle underlies the classification of topographic maps by scale:
- Small-scale . Images in proportion 1:200000 or 1:1000000. They are necessary for studying a specific territory, during planning activities related to the development of the national economy, as well as during the construction of industrial structures. In addition, small-scale maps are used to calculate useful resources and water space.
- Medium-scale . These are intermediate type cards with proportions 1:250000, 1:50000, 1:100000. Site plans using these scales are highly accurate. Such maps are widely used in the national economy, for military purposes, for various calculations, as well as for planning geodetic or prospecting work.
- Large scale . Maps with aspect ratios 1:5000 and 1:10000. They are necessary when conducting exploration by geologists and when planning the construction of industrial and transport facilities. Large-scale maps are used by the military for tactical and strategic purposes.
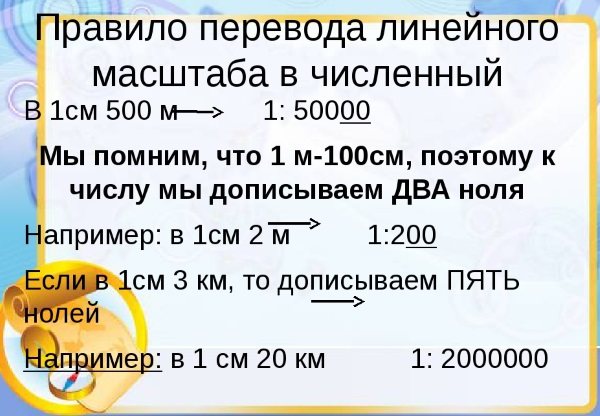
Scale is indicated on maps in different ways:
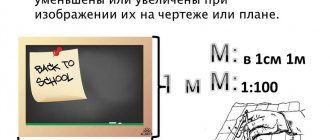
- Numerical . The notation looks like a fraction with a numerator equal to one and a denominator equal to the degree of reduction. It is used as an explanation and written on one of the frames of the card. The numerical scale indicator is equal to the value that corresponds to 1 cm.
- Linear . The explanation looks like a ruler divided into equal sections. A linear scale is necessary for those specialists who, while studying a topographic map, measure distances and convert them into natural values.
The scale of the map is directly related to the amount of detail that the cartographic image has.
The map scale used for cartographic images is established by a single order of the Ministry responsible for the economic development of the country.
The scaling order is clearly regulated by the rules, so the error of cartographic images is minimized.
Card colors
The color design of topographic maps involves highlighting the corresponding objects in color:
- shrubs, forests and other green mass in the territories are indicated in green;
- the body of water and glaciers are colored turquoise;
- relief, various types of soil are colored orange;
- improved roads are highlighted in yellow;
- for settlements and cities with a population of more than 50 thousand, the color is orange;
- sands and rocky surfaces are highlighted in brown.
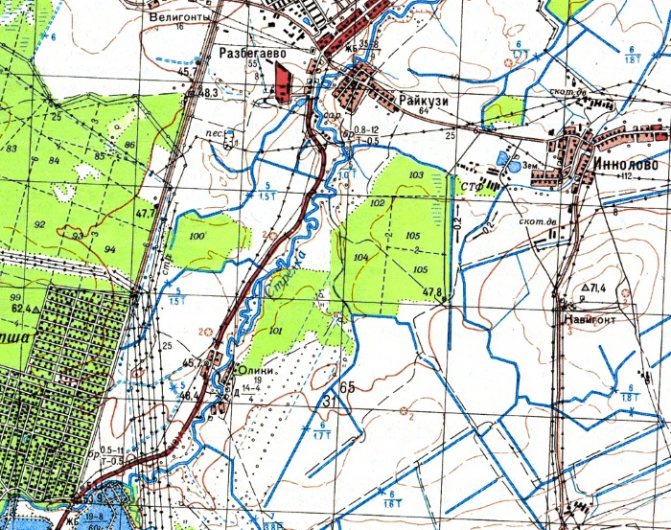
For other designations use black.
Concept and classification of conventional signs
A topographic map is a structured system of images for which conventional cartographic signs are of great importance. Experts divide them into signs of general use, as well as signs used to identify objects in the professional field.
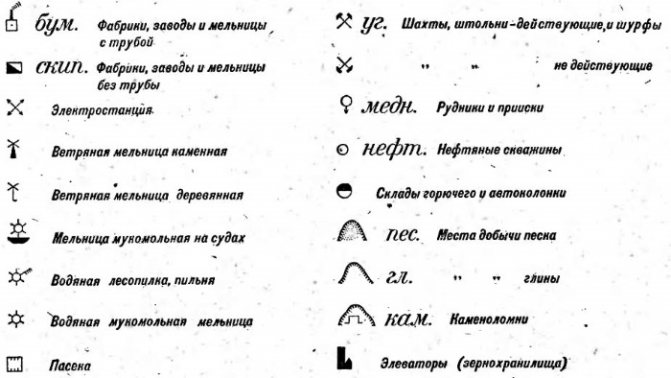
For the convenience of using such signs, a special classification system has been introduced:
- Area . Designed to identify macro objects: meadows, lakes, rivers. With the help of area symbols, a cartographic image not only determines the location of an object, but also helps to imagine its real dimensions. Application rules provide for partial or complete shading of the body of the figure.
- Spot . These are objects of minimal size that cannot be fully displayed on the map due to scale: road signs, free-standing pillars, wells, monuments.
- Linear . Symbols that indicate roads, their length, and boundary lines of industrial structures.
General concepts of cartography
Since human society began to develop, there has been a need to display and store certain information.
Since the emergence of man's first knowledge of the world around him, the question of the transfer of information of a geographical nature has arisen. An important object of geographical information was the earth's surface, territory. One of the main ways of transmitting information about the earth's surface was its outline. This is how the geographical map appeared. But in order to depict part of the territory, it was necessary to reduce the image to fit it on the drawing sheet.
Definition 1
A geographical map is a drawing of a section of the earth's surface, made using conventional symbols and on a certain scale.
Definition 2
Scale is a mathematical expression that indicates how many times an image is enlarged or reduced compared to its actual dimensions.
Methods of cartographic representation
Conventional signs take into account the characteristics of objects, describing their quantity and quality.
Isolines
They are called level lines. These are lines connecting in pairs points of identical indicator values on the map. They are used to indicate temperature levels and pressure indicators.
The method using isolines is considered the most informative for measurements. The peculiarity of the image of isolines is the coloring of the spaces between them. It allows you to take into account the decrease and increase of a specific indicator.
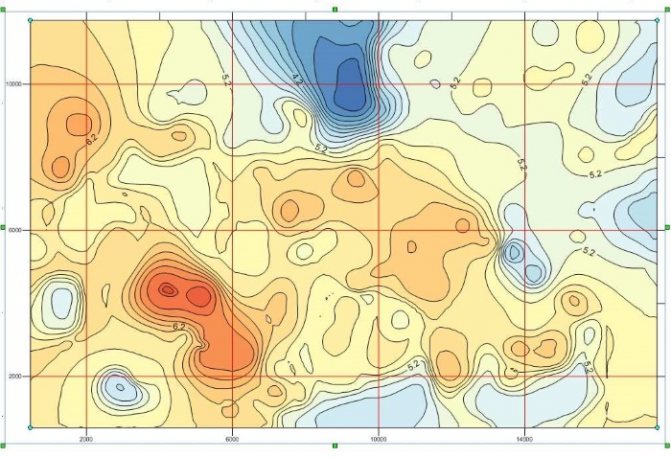
Main types of isolines:
- indicator of average wind speed – isoanemon;
- indicators of tectonic movements of rocks - isobase;
- level of equal heights – isohypsum;
- level of rock layers – isopach;
- a line indicating the uniformity of precipitation - isohyet;
- depth level of reservoirs - isobath.
Mapping methods
Linear signs are used to describe objects that have a clear boundary.
Using color highlighting, the dynamics of changes in an object are indicated:
- High quality background . This is a color way of depicting an object. It is associated with the designation of the adjacent territory, and shading is used as a clarification.
- Oscillation diagram . A method that allows you to clarify changes in temperature, precipitation and air masses.
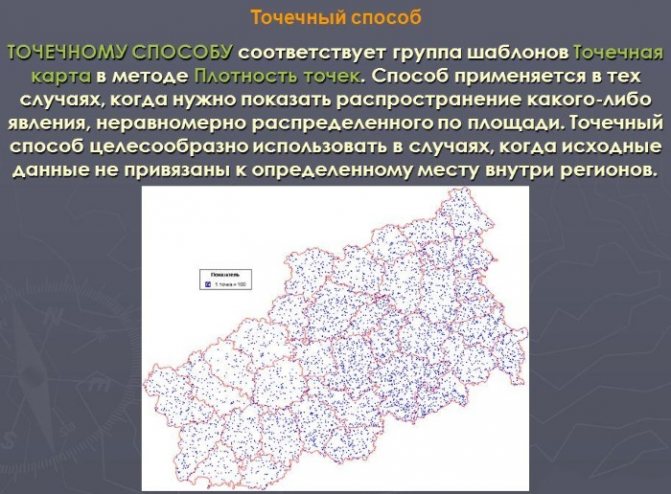
- Spot. It is used to designate crop areas and livestock numbers.
- Habitats . They are highlighted on the map by applying special colors, shading, icons, and symbols. It is allowed to use traffic signs that can show the direction of movement of the population, cyclones, birds, and electricity.
- Cartodiagram . Reflection of statistics for units of administrative-territorial division.
- Dynamic signs . This is one of the youngest methods of cartographic representation. It is used to enhance the animation effect.
Classification of maps by territory coverage
Depending on the territories depicted on the maps, maps are divided into maps of the world (including maps of the hemispheres), maps of individual continents and oceans, maps of individual countries, maps of parts of countries (regions). The greater the coverage of the mapped territory, the less details and details the map contains. Otherwise, on a small surface there will be a large number of difficult to distinguish symbols.
Definition 3
The selection of the most important objects for the image is called cartographic generalization .
default/handbook/article/googleContextBlock.twig
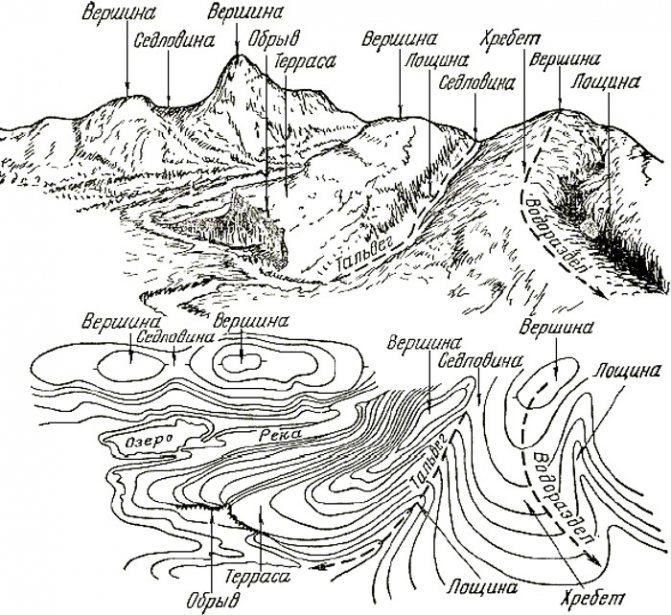
Terrain imaging methods
Relief is one of the most important structures of the geographical envelope. Its image on topographic maps plays a significant role: it influences the position of accompanying elements.
Additional items and objects are placed in the relief pattern. The depiction of relief is associated with difficulties in reliably conveying its volume. Several methods are used to draw relief.
Horizontals
This method is used on large-scale topographic maps. The horizontal line is graphically represented by a line connecting equal height indicators. To graphically describe the relief with horizontal lines, the territory is dissected by several horizontal planes, which are located at a distant distance from each other.
Depending on the nature of the relief, the dissection ranges from 2 to 5 planes.
The section is taken as the height of the relief and is designated as h. Horizontal planes have no intersection points. Mountains, slopes, volumetric basins can be depicted as closed horizontal planes with the direction of the shading down or up.
Types of contours:
- solid;
- thickened;
- additional or semi-horizontal;
- auxiliary.
With marks
Marks highlight individual points on the ground; for this purpose, captions are used in a predetermined font.
Color and symbols
The washing method is used for small-scale maps . The method allows the use of color notations. The surface of the earth is predominantly painted brown, while water bodies are highlighted in turquoise.
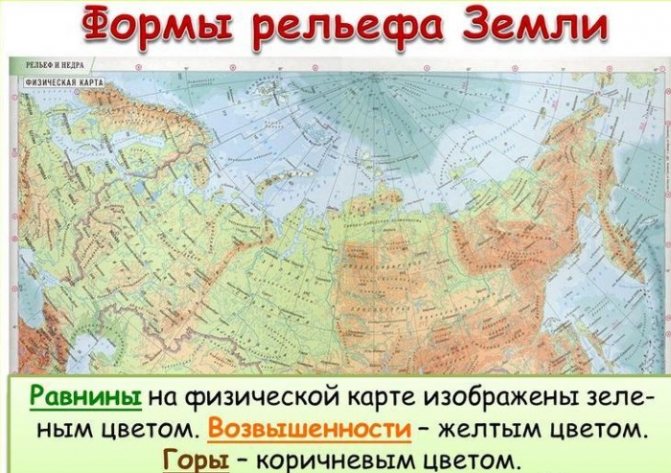
The coloring is made more clear or blurred; these techniques make it possible to determine the depths and heights at the first glance at the signs. Conventional signs in the form of three-dimensional drawings of animals and plants are often used to provide a perspective representation of flora and fauna on children's maps.
Types of map projections
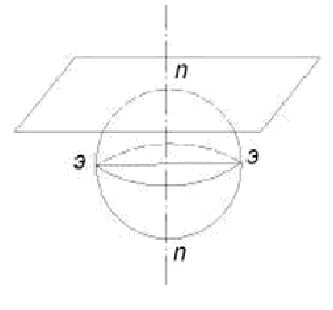
Let's not forget that the Earth is a sphere, and the map is a plane. Therefore, to transfer an image from a spherical surface to a plane, the projection method is used.
Finished works on a similar topic
- Course work Types of geographical maps, their classification 480 rub.
- Abstract Types of geographical maps, their classification 240 rub.
- Test work Types of geographical maps, their classification 190 rub.
Receive completed work or specialist advice on your educational project Find out the cost
A map projection is a method of transferring an image of the earth's surface from a sphere to a plane. Depending on the relative position of the sphere and the plane, the following main types of map projections are distinguished:
- azimuthal;
- conical;
- cylindrical.
Sometimes combined projections are used - polyconical, pseudoconical and pseudocylindrical. The main purpose of projections is to reduce image distortion that inevitably occurs when transferring an image from a sphere to a plane. It is impossible to completely avoid distortions. They just need to be taken into account.
The following types of distortion are distinguished:
- length distortions;
- distortion of corners;
- distortion of areas and distortion of shapes.
Depending on the projection chosen, we may reduce the effect of one distortion, but some other distortion will be increased. Only on the globe there is practically no distortion. On topographic maps, due to the small area of the depicted territory, distortions are so insignificant that they can be neglected.
default/handbook/article/yandexContextRtb.twig
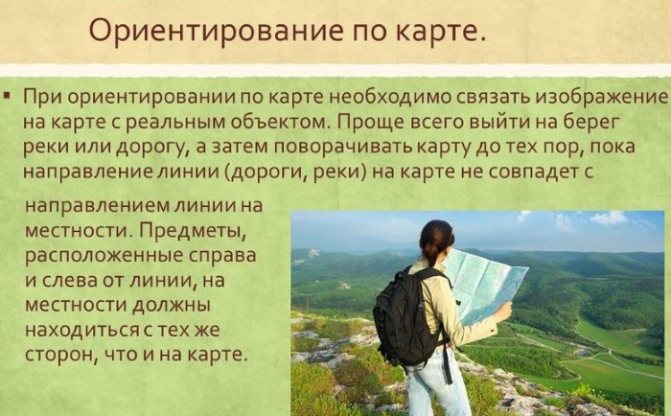
Orientation using a map
Orientation is a way of determining location by objects that appear around you. The use of topographic maps for orientation is the task of people in many professions.
Orientation has 3 main tasks:
- Recognition of the area by basic features and calculation of location, recognition of the direction of movement in a specific area.
- Calculation of the sides of the horizon and one’s location, tactical determination of location for military-strategic purposes.
- Approximate calculation of the location and direction of movement, as well as calculation of the time to reach a certain point.
Orientation using a topographic map is considered one of the main ways to solve problems.
Determining geographic coordinates on a topographic map
Geographic coordinates are width and longitude; they facilitate calculations for the location of a specific object on the surface of the earth, based on a coordinate system. Topographic type maps are those maps that are covered with frame grids. The meridians are the east and west directions, and the north and south frames are parallels.
To calculate the geographic coordinates of a specified point, find a parallel and meridian located close to it.
The cartographic image grid is divided into minutes with a minimum of 10 seconds. The frames on the sides are taken as an indicator of the corresponding latitude, and the top and bottom sides are taken as longitude.
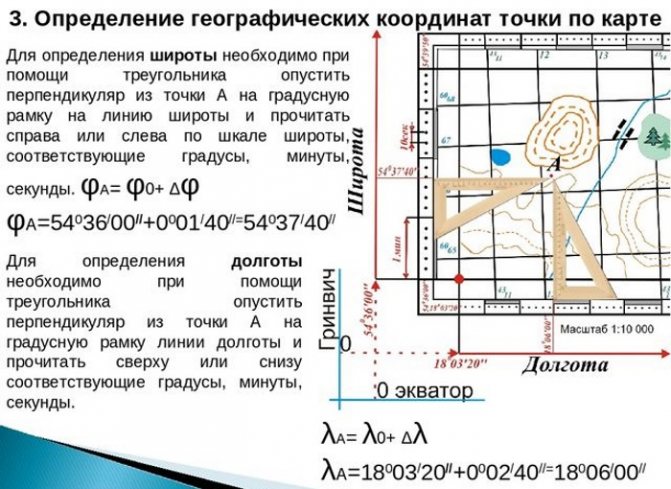
To calculate geographic coordinates, measure the distance from a specific point to the southern side of the frame, then apply an equal segment of a measuring compass on the other side and set the minutes in a specific time period. The minute indicators are added to the determined indicators of the southwestern corner of the grid, thus obtaining the latitude.
Longitude is also measured, while the indicators on the other side of the frame, which symbolizes the coordinate system, are measured. The method of calculating coordinates from topographic maps is often used for military-strategic purposes. Determining the location by width and longitude allows you to accurately determine the location of the object.
Measuring distances on a map
To calculate distances, maps with refinements of numerical and linear scales are used:
- Straight lines. A ruler is used for fixation. The indicator obtained as a result of the measurement is multiplied by the scale value of a particular map.
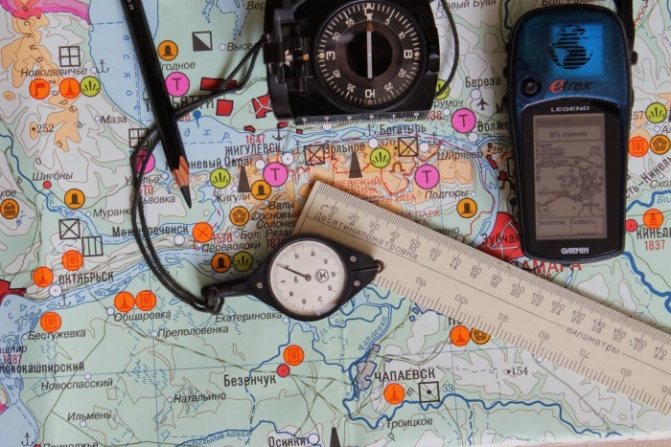
- To measure the values of indirect segments, a compass is used . The indicator is multiplied by the scale mark, taking into account a coefficient that allows fluctuations due to the nature of the terrain.
- Curved lines of a sinuous type . A curvimeter is suitable for measurement. This is a device that consists of a wheel connected to a dial along which a sensitive hand moves. As the wheel moves across the territory shown on the map, the arrow begins to oscillate to indicate the desired distance. It is expressed in centimeters. Before starting measurements, the curvimeter indicator is set to position “0”. The result is multiplied by a value corresponding to the map scale. The resulting value is the distance in the designated area that needed to be measured.
- Squares . The area of a specific object is calculated using the squares of the coordinate grid. Straight lines will show more accurate results than curved lines.
Specialist cartographers point out that measuring distances in mountainous areas is made difficult by the discrepancy in heights. To increase the accuracy of measurements, special coefficients are adopted that take into account the nature of the terrain and the scaling scale.
Relief characteristics
To characterize the relief depicted on a topographic map, use the available data:
- Absolute altitude is a segment from ocean level to a point on the earth's surface.
- Relative altitude is an indicator that reflects the difference between one point above sea level and another.
- The relief section is the difference between 2 adjacent heights.
The cross-section of the relief is determined by the map scale, and also depends on the type of relief. It is expressed as a numerical value in the map legend. To understand the characteristics of the terrain, it is necessary to take into account the presence of ascents and descents. In addition, the directions of river flow, which are indicated by black arrows on topographic maps, are important.
Taking into account the listed indicators, changes in the characteristics of the relief and the difference between relative heights in the proposed areas are identified using a topographic map.
Determining the steepness of the slope
The steepness of the slope is the angle of inclination. Using a cartographic image, in which the relief is depicted using the contour lines method, and is also combined with height indicators, you can find the steepness of the slope at given marks. The direction of the slope is graphically described by perpendicular horizontal lines and expresses its greatest steepness.
As a rule, tasks to identify the steepness of a slope are accompanied by indicating 2 points on the map. A connecting line is drawn between them. Its type depends on the type of horizontal. The line intersects adjacent parts at an angle of 90°, this determines the direction of the steepness.
The numerical value of the slope steepness is calculated according to the established depth scale. With minimal estimates of the location, the slope is depicted as flat. The pitch scale is a numerical expression indicating the slope using a degree measure.
To calculate it, measure the segment from one adjacent horizontal line to another in the same direction.
Then mark the same segment on the placement scale using a compass. The indicator on the scale that will be opposite the delayed segment is the steepness of the slope in degrees. Using a topographic map is a necessity when you need to study the relief in a proposed area or calculate the geographic coordinates of the location of a given object.
Topography is a science that is actively developing along with the improvement of computer technology. They help increase the accuracy of indicators and eliminate the error of the information provided.
Article design: Oleg Lozinsky
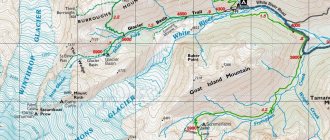
FRAMEWORK OF THE CARD SHEET. DETERMINATION OF GEOGRAPHICAL COORDINATES. GEODETIC BASIS OF TOPOGRAPHIC MAPS
Sheet frames . The inner frame of a topographic map sheet, limiting the cartographic image, is formed by straightened arcs of parallels and meridians, and, therefore, map sheets are trapezoids. At the vertices of the trapezoids (corners of the frames) their geographical coordinates are indicated. The dimensions of the sheets in latitude and longitude strictly comply with the standard layout. In the example in Figure 16, the map sheet has dimensions of 2'30" in latitude and 3'45" in longitude, which corresponds to a map scale of 1:10,000.
A minute frame is drawn parallel to the inner frame - a double line, divided into segments corresponding to one minute of latitude - on the western and eastern frames and a minute of longitude - on the northern and southern frames. On maps of scales 1: 100,000 and larger, minute divisions are divided by dots into segments of 10" (Fig. 17).
A thick outer frame separates the card itself from the equipment and additional characteristics placed on the margins.
Determining the geographic coordinates of objects shown on the map and plotting points at given coordinates is done using minute frame scales. When determining the latitude of point A (Fig. 17), a ruler is applied to it so that it connects the divisions of the same name on the scales of the western and eastern frames, and a reading is taken on these scales.
Rice. 17. Determining the geographic coordinates of point A using a topographic map. The dotted lines indicate the parallel and meridian drawn through a given point
The longitude of point A is determined in the same way using the scales of the southern and northern frames. To plot a point or detect an object by its coordinates, draw a parallel and a meridian with the given coordinates on the map along a ruler, using the scales of the minute frame. At the point of their intersection, this object is placed.
The geodetic basis of topographic maps ensures the correct position of objects on the map. The geodetic basis of the maps is made up of points of the state geodetic (planning and altitude) network and individual survey justification points. The exact coordinates of these points, contained in special catalogs, serve to plot the points on the map being compiled. When making a map, a coordinate grid is constructed on paper in a certain way and the corners of the trapezoid frames and the reference points of the geodetic basis are plotted on it with great accuracy (0.2 mm). The drawing of the cartographic image then seems to fit between them. The accuracy of the map depends on the degree of correspondence of the position of the contours relative to the reference points. The instructions stipulate that the average errors in the planned position of objects and terrain contours relative to the nearest geodetic points should not exceed 0.5 mm for flat areas, and 0.75 mm for mountainous areas.
This is how the transition from the physical surface to the surface of the ellipsoid and to the map is practically carried out.
On a map of scales 1:10,000 - 1:100,000 all geodetic points of classes 1, 2, 3 are plotted, and class 4 points and survey network points with selection. Ground markings of points in some cases can serve as reliable landmarks. In addition, geodetic points are used during construction, road, and defense work to link structures on the ground.
PROJECTION OF TOPOGRAPHIC MAPS OF THE USSR. RECTANGULAR COORDINATES
Projection of topographic maps of the USSR . To reduce the inevitable distortions that arise when depicting large territories on a plane, they resort to mapping the territories in parts. When creating topographic maps (except for maps at a scale of 1:1,000,000) in the USSR and a number of other countries, the equiangular transverse cylindrical Gauss-Kruger projection is used, in which the surface of the ellipsoid is divided into spherical diagons (zones) and then each of them is depicted separately on the plane (Fig. 18). In this case, the middle (axial) meridian of the zone and the equator will be depicted as mutually perpendicular straight lines without distortion.
Rice. 18. Image of geodetic zones on a plane
Distortions gradually increase with distance from the axial meridian. To reduce them to a minimum, the sizes of zones in longitude are limited to six degrees, and six-degree zones are used to construct maps at a scale of 1:10,000 and smaller.
For maps at a scale of 1:5000 and larger, three-degree zones are used. The entire earth's ellipsoid is covered by 60 six-degree zones. They are numbered in Arabic numerals, starting from the Greenwich meridian to the east. The first zone is between 0° and 6° E, the second - between 6° and 12°, etc. The boundaries of the Gauss-Kruger zones coincide with the boundaries of the columns (when plotting a map at a scale of 1:1,000,000), but their the numbering differs by 30 units, so column N° = zone N° +30.
Rice. 19. Schematic representation of the Gauss-Kruger zone on a plane
The zone is depicted on a plane according to a certain mathematical law and takes the form as schematically shown in Figure 19. In reality, it is a very narrow strip, the width of which at the equator is 30 times less than its length between the poles. Meridians (except the axial one) and parallels are depicted on a plane by lines with curvature. The axial meridian has a true length on the map scale, the length of the remaining meridians increases with distance from the axial one, however, the greatest distortions of lengths within the zone (at the extreme meridian at the equator point) do not exceed 0.0014. Distortions of areas and angles are also small. Within the territory of the USSR they are even smaller. Thus, errors in areas and in the position of contours on the map are significantly less than the accuracy of reproduction of maps in print, deviations due to paper deformation, etc. Therefore, we can assume that the image of a zone in the Gauss-Kruger map projection has practically no distortions and allows for various measurements.
When creating maps, the zone is divided into separate sheets, each of which has the form of an equilateral trapezoid, limited by segments of parallels and meridians.
Rectangular coordinates . On a plane in the Gauss-Kruger zone, a rectangular coordinate system is used, in which the axial meridian of the zone is taken as the x-axis X, and the image of the equator is taken as the y-axis (Fig. 20). In topography and geodesy, orientation is carried out according to the north, counting angles clockwise. Therefore, to preserve the signs of trigonometric functions, the position of the coordinate axes in the Gauss-Kruger zone is rotated 90° relative to the axes adopted in the Cartesian system of rectangular coordinates. The positive direction of the axes is taken to be: for the X axis - the direction to the north, for the Y axis - to the east. The position of point A in the coordinate zone is determined by its distance XA and YA from the coordinate axes. On the territory of the USSR, all abscissas (distances from the equator) are positive. As for the ordinates, they could be either positive or negative in each zone. For the convenience of working with maps, it was agreed that the Y ordinate value of the axial meridian of each zone should be equal to 500 km, i.e. the origin of coordinates seemed to be moved to the west outside the zone. The number 500 was chosen because the distance along the equator from the axial meridian to the extreme western meridian is 3° or 333 km, and it would be inconvenient to count ordinates from an axis with such an ordinate. Rectangular coordinates of objects on the map are expressed in kilometers and their parts.
Rice. 20. Axes of rectangular coordinates of the zone and coordinates of points A and B located in zone 7
Since the same coordinates of points can be repeated in each of the 60 zones, the number of the zone in which a given point is located is indicated in front of the Y ordinate. For example, the coordinates of point A, located in the 7th zone, are written as follows: XA = 6230.200; YA = 7400.150 (Fig. 20).
To plot points using rectangular coordinates and determine the coordinates of points on topographic maps (except for maps at a scale of 1:1,000,000), there is a rectangular coordinate grid in the form of a system of squares formed by lines parallel to the X and Y axes (Fig. 21). Grid lines are drawn depending on the map scale at distances of 1 or 2 km (taken at the map scale), and are therefore often called kilometer lines , and a grid of rectangular coordinates - a kilometer grid .
Rice. 21. Layout of the map sheet (shaded) and rectangular grid lines within the zone
The kilometer grid lines are not parallel to the map frames because the straight coordinate axes are not parallel to the meridians and parallels, which have curvature. Grid lines parallel to the equator have a constant abscissa, and zones parallel to the axial meridian have a constant ordinate. The first ones on the map are approximately horizontal, the second ones are perpendicular to them.
The coordinates of the grid lines, expressed in km, are signed at the map frames (between the inner and minute frames): the abscissas of horizontal lines are at the side frames, the ordinates of vertical lines are at the upper and lower frames (see Fig. 22). Near the corners of the map, the rectangular coordinates of the lines are signed in full, with the first two digits in a smaller font than the last two. For intermediate lines, only the last two digits are indicated large to avoid repetition. So, for example, near the eastern frame of the map sheet, schematically shown in Figure 16, the abscissas of the horizontal kilometer lines from south to north are as follows: 6015, 16, 17 and 6018; near the northern frame the ordinates of the vertical kilometer lines 7456, 57, 58 and 7459 km are signed, they read as the 7th zone 456 km, etc.
Rice. 22. Position and digitization of rectangular coordinate grid lines on a sheet of map of scale 1:100,000 (fragment) and determination of rectangular coordinates of points
The ordinate labels on topographic maps are consistent with the nomenclature of the map sheet, taking into account that the zone number is 30 less than the column number indicated in the nomenclature. When connecting map sheets within one zone, the kilometer lines of adjacent sheets exactly coincide, and at the border of the zones they are located at a certain angle to each other. To ensure the possibility of working on adjacent map sheets included in different zones, the outputs of the coordinate lines of the adjacent zone are applied to them. The coordinates of these lines are signed outside the outer frame of the sheet (see Fig. 22).
Using a kilometer grid, you can quickly find the coordinates of objects, plot points by coordinates, and indicate the location of objects on the map. The rectangular coordinates of the point through which the kilometer grid lines pass on the map (such as point A in Fig. 22) are obtained immediately by reading the digitization of the coordinate lines on the map frames.
The coordinates of the points lying inside the grid cells are determined by the coordinates of the grid lines closest to the point and the increment of the coordinates of the points relative to these lines. Thus, the coordinates of point B (Fig. 22) are as follows: XB = 6132 + ΔX; YB = 7312 + ΔY. Increments of coordinates ΔX and ΔY are measured using a compass and a linear map scale, summed with the coordinates of kilometer lines. As a result, XB = 6,133.280; YB = 7,313.450.
Coordinate increments can be measured using a coordinate meter , a small square with two perpendicular sides. Along the internal edges of the rulers are scales, the lengths of which are equal to the length of the side of the coordinate cells of the map of a given scale. The horizontal scale is aligned with the bottom line of the square (in which the point is located), and the vertical scale must pass through this point. The distances from the point to the kilometer lines are determined using the scales (Fig. 23).
Rice. 23. Measuring rectangular coordinates of points using a coordinate meter
To plot a point on a map according to given rectangular coordinates, proceed as follows: using the value of the abscissa X, taking into account only the whole number of kilometers, find the horizontal coordinate line to the north of which the point will be located; Using the value of the Y ordinate, they similarly determine the vertical coordinate line, to the east of which the desired point will be located, and thus find the desired square. The remaining fractions of kilometers (coordinate increments) are plotted with a meter on a linear scale: on both horizontal sides of the square to the east - the ordinate increment ΔY, and along both vertical lines to the north - the abscissa increment ΔX. Through the obtained points, vertical and horizontal lines are drawn, at the point of intersection of which the given point is located.
To quickly indicate the location of an object on a given map sheet, abbreviated coordinates of the southwestern corner of the corresponding square of the kilometer grid are used. From the designations of both kilometer lines, take the last two digits, printed in large font, and write them so that the first two digits refer to the southern side, and the last two to the western side of the square. For example, in Figure 22, point B is located in square 3212, and in Figure 16, point B is in square 1656.
An important area of application of the rectangular grid - for orientation purposes - is discussed in §15.
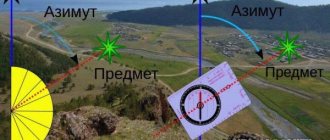
DIRECTION ANGLES
When working with a topographic map, the task of determining directions often arises. Direction angles (or position angles) are measured relative to the initial direction, which can be taken as the geographic (true) meridian, magnetic meridian, or axial meridian of the Gauss-Kruger zone.
Depending on the accepted initial direction, a distinction is made between geographic (true) azimuth, magnetic azimuth, and directional angle.
Geographical (true) azimuth A direction is the angle measured from the north direction of the geographic meridian clockwise to a given direction ranging from 0° to 360°. To measure the geographic azimuth of a given direction on a map at the starting point of the line, draw the geographic meridian along a ruler (in the same way as when determining geographic coordinates) and use a protractor to measure the angle between the meridian and the given direction.
The magnetic azimuth of the AM direction is the angle measured from the northern end of the magnetic meridian to the determined direction clockwise in the range from 0° to 360°. Magnetic azimuths of directions are measured on the ground using instruments equipped with a magnetic needle (compasses, compasses). From a map, magnetic azimuths can be calculated from the measured true azimuth A and the magnetic declination b indicated in the margins of the map.
Magnetic declination (declination of the magnetic needle) is the angle between the true (geographic) and magnetic meridians. The declination from the true meridian to the east is considered eastern - positive, to the west - western - negative. AM=A -δ, where the declination δ can be eastern or western and is accordingly given with a plus or minus sign (Fig. 24).
Rice. 24. Angles of direction of the line OL: A - true azimuth; AM—magnetic azimuth; α—directional angle; γ — convergence of meridians; δ — magnetic declination
The directional angle α direction is the angle measured on the map from the northern direction of the axial meridian of the zone and lines parallel to it (vertical kilometer lines), to a given direction clockwise in the range from 0° to 360°. The use of vertical grid lines makes it possible to quickly and accurately measure directional angles at any point on the map using a protractor (Fig. 25). From magnetic azimuths measured on the ground, directional angles can be calculated if the amount of convergence of the meridians is known, i.e. the angle γ between the northern direction of the geographic meridian of a given point and the northern direction of the vertical grid line (Fig. 24). For points located in the eastern part of the coordinate zone (east of the axial meridian), the convergence value is positive, and for points located in the western part, it is negative. The maximum value of the angle of approach of the meridians does not exceed 3°, therefore it is not always taken into account in practical work.
AM = α - δ + γ ;
α = AM + δ - γ ;
A=α + γ
Rice. 25. Measurement of directional angles of directions using a protractor using maps. Measured angles are shaded
The algebraic difference δ - γ = Π is called the direction correction. Information on the magnitude of the angles of convergence of meridians and magnetic declination is given under the southern frame of the map.
Directions on the map are drawn according to directional angles, for which a straight line is drawn through the starting point, parallel to the vertical lines of the coordinate grid. A protractor is applied to it, as indicated in Figure 25, and a mark is made on the map against the corresponding reading on the protractor scale. The mark is connected by a straight line to the starting point.
rhumb r is a directional angle not exceeding 90°, formed by the meridian and the given direction; The rhumb is measured from the nearest direction (north and south) of the meridian clockwise and counterclockwise. There are geographic (measured from the geographic meridian), magnetic (measured from the magnetic meridian), and also points measured from vertical kilometer lines. To completely determine the direction of the line, the angular value of the rhumb is accompanied by an indication of the quarter of the horizon where this line lies (Fig. 26).
The connection between azimuths and directions is clear from the figure.
Rice. 26. Relationship between rhumbs and azimuths of directions
In measurement practice, it is necessary for control to measure the direction angles of lines in the forward and reverse directions. Angles measured at the starting point of a line are called right angles, and angles measured in the opposite direction (or at the end point of the line) are called reverse angles.
In the general case, the meridians are not parallel to each other, an angle is formed between them, called the convergence of the meridians y, therefore the direct and reverse azimuths are in the following relationship: Aobr. = Apr. ± 180° + γ (Fig. 27).
Rice. 27. Forward and reverse azimuths of direction. The dotted line at point 2 is a straight line parallel to the meridian of point 1
The directional angle of a straight line is constant at all points (within one zone), therefore αarr. = αpr . ± 180° (Fig. 28).
Rice. 28. Directional angles of directions in the Gauss-Kruger zone: αAB = α1 = α2 = α ; αBA = α - 180°; αCD = α'1 = α'2 = α'; αDC = α' + 180°; αarr. = αpr. ± 180°